
Development of life expectancy in South Africa according to estimation of the World Bank Group
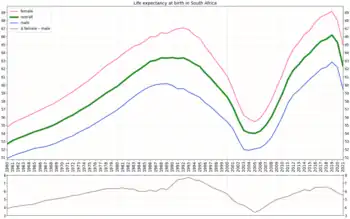
Life expectancy with calculated gender gap
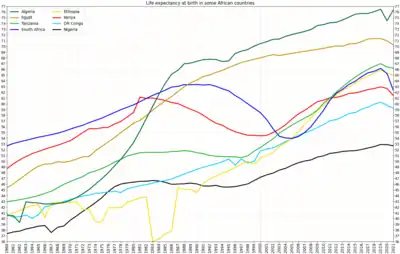
Development of life expectancy in South Africa in comparison to some other African countries
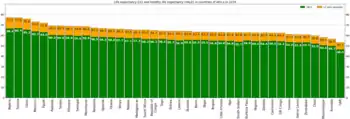
Life expectancy and healthy life expectancy in Africa on the background of other countries of Africa in 2019
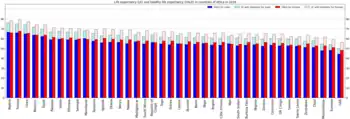
Life expectancy and healthy life expectancy for males and females
This article lists the provinces of South Africa by their average life expectancy at birth according to data by Statistics South Africa.
Males
| Rank | Province | 2001–2006 | 2006–2011 | 2011–2016 | 2016–2021 (est.) |
|---|---|---|---|---|---|
| 1 | Western Cape | 59.6 | 61.1 | 63.9 | 65.7 |
| 2 | Gauteng | 55.4 | 56.5 | 61.6 | 63.8 |
| 3 | Limpopo | 54.3 | 54.4 | 59.3 | 61.8 |
| 4 | Northern Cape | 51.9 | 52.9 | 56.8 | 60.4 |
| 4 | Mpumalanga | 52.4 | 53.3 | 57.8 | 60.4 |
| 6 | Eastern Cape | 52.3 | 53.0 | 57.3 | 59.6 |
| 7 | North West | 49.1 | 50.3 | 56.6 | 57.9 |
| 8 | KwaZulu-Natal | 47.5 | 48.3 | 54.6 | 57.1 |
| 9 | Free State | 45.6 | 46.3 | 53.1 | 54.6 |
Females
| Rank | Province | 2001–2006 | 2006–2011 | 2011–2016 | 2016–2021 (est.) |
|---|---|---|---|---|---|
| 1 | Western Cape | 64.5 | 67.2 | 70.6 | 71.1 |
| 2 | Gauteng | 59.2 | 60.9 | 66.6 | 69.2 |
| 3 | Limpopo | 57.7 | 58.6 | 65.1 | 67.4 |
| 4 | Eastern Cape | 56.8 | 58.6 | 64.0 | 67.1 |
| 5 | Mpumalanga | 56.1 | 57.6 | 63.5 | 66.2 |
| 6 | Northern Cape | 57.2 | 58.5 | 63.3 | 66.0 |
| 7 | North West | 53.3 | 55.0 | 62.6 | 65.2 |
| 8 | KwaZulu-Natal | 52.6 | 54.4 | 60.9 | 63.7 |
| 9 | Free State | 49.2 | 50.7 | 58.6 | 61.3 |
See also
Wikimedia Commons has media related to Life expectancy charts for South Africa.
References
- 1 2 "Mid-year population estimates 2019" (PDF). Statistics South Africa.
| Ranked |  | |
|---|---|---|
| Political | ||
| Other | ||
This article is issued from Wikipedia. The text is licensed under Creative Commons - Attribution - Sharealike. Additional terms may apply for the media files.