This is a list of African countries by life expectancy at birth.
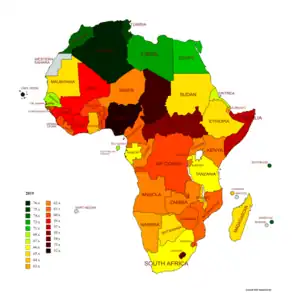
World Bank Group (2021)
Estimation of the World Bank Group for 2021.[1][2][3] The data is filtered according to the list of countries in Africa. The values in the World Bank Group tables are rounded. All calculations are based on raw data, so due to the nuances of rounding, in some places illusory inconsistencies of indicators arose, with a size of 0.01 year.
| Countries & territories |
2021 | Historical data | COVID-19 impact | |||||||||||||
|---|---|---|---|---|---|---|---|---|---|---|---|---|---|---|---|---|
| All | Male | Female | Gender gap |
2000 | 2000 →2014 |
2014 | 2014 →2019 |
2019 | 2019 →2020 |
2020 | 2020 →2021 |
2021 | 2019 →2021 |
2014 →2021 | ||
| 76.38 | 74.88 | 77.96 | 3.08 | 70.48 | 4.63 | 75.11 | 1.36 | 76.47 | −2.02 | 74.45 | 1.92 | 76.38 | −0.10 | 1.27 | ||
| 74.05 | 69.59 | 78.46 | 8.87 | 68.62 | 6.62 | 75.24 | 0.76 | 76.00 | −1.20 | 74.81 | −0.76 | 74.05 | −1.95 | −1.19 | ||
| 74.04 | 71.89 | 76.40 | 4.50 | 66.79 | 5.75 | 72.54 | 1.73 | 74.27 | −0.35 | 73.92 | 0.12 | 74.04 | −0.23 | 1.50 | ||
| 73.77 | 70.74 | 77.14 | 6.40 | 73.69 | 1.96 | 75.65 | 0.34 | 75.99 | −0.70 | 75.29 | −1.52 | 73.77 | −2.22 | −1.88 | ||
| 73.68 | 70.29 | 77.24 | 6.95 | 71.66 | 2.53 | 74.19 | 0.04 | 74.24 | −0.06 | 74.18 | −0.50 | 73.68 | −0.56 | −0.51 | ||
| 73.40 | 71.30 | 75.60 | 4.30 | 72.78 | 0.45 | 73.23 | 0.82 | 74.05 | 3.19 | 77.24 | −3.84 | 73.40 | −0.65 | 0.17 | ||
| 71.91 | 69.63 | 74.40 | 4.77 | 70.68 | 0.83 | 71.51 | 0.95 | 72.46 | 0.01 | 72.47 | −0.56 | 71.91 | −0.55 | 0.40 | ||
| World | 71.33 | 68.89 | 73.95 | 5.06 | 67.70 | 4.18 | 71.88 | 1.10 | 72.98 | −0.74 | 72.24 | −0.92 | 71.33 | −1.65 | −0.55 | |
| 70.22 | 67.94 | 72.61 | 4.67 | 68.01 | 2.41 | 70.42 | 0.94 | 71.36 | −0.37 | 70.99 | −0.77 | 70.22 | −1.14 | −0.19 | ||
| 67.59 | 65.16 | 70.42 | 5.26 | 61.66 | 5.19 | 66.84 | 1.68 | 68.52 | −0.74 | 67.78 | −0.19 | 67.59 | −0.93 | 0.75 | ||
| 67.09 | 64.75 | 69.28 | 4.53 | 56.94 | 9.51 | 66.45 | 2.07 | 68.53 | −0.52 | 68.01 | −0.91 | 67.09 | −1.43 | 0.64 | ||
| 66.54 | 64.35 | 68.66 | 4.31 | 56.11 | 9.49 | 65.60 | 1.70 | 67.30 | −0.17 | 67.13 | −0.60 | 66.54 | −0.76 | 0.94 | ||
| 66.20 | 64.18 | 68.31 | 4.13 | 52.36 | 11.51 | 63.87 | 3.12 | 66.99 | −0.58 | 66.41 | −0.21 | 66.20 | −0.79 | 2.33 | ||
| 66.07 | 63.80 | 68.16 | 4.37 | 47.13 | 17.81 | 64.94 | 1.50 | 66.44 | 0.34 | 66.77 | −0.70 | 66.07 | −0.36 | 1.13 | ||
| 65.82 | 63.49 | 68.49 | 5.01 | 61.07 | 3.91 | 64.97 | 1.63 | 66.60 | −0.07 | 66.53 | −0.71 | 65.82 | −0.78 | 0.85 | ||
| 65.27 | 62.74 | 67.88 | 5.14 | 58.32 | 5.95 | 64.27 | 1.61 | 65.88 | −0.26 | 65.61 | −0.35 | 65.27 | −0.61 | 1.00 | ||
| 64.97 | 61.91 | 68.28 | 6.38 | 50.54 | 12.37 | 62.91 | 2.93 | 65.84 | −0.47 | 65.37 | −0.40 | 64.97 | −0.86 | 2.07 | ||
| 64.48 | 62.23 | 66.87 | 4.64 | 57.94 | 6.32 | 64.25 | 1.63 | 65.88 | −0.70 | 65.18 | −0.70 | 64.48 | −1.40 | 0.23 | ||
| 64.36 | 62.67 | 66.10 | 3.43 | 61.03 | 3.13 | 64.16 | 1.53 | 65.69 | −1.16 | 64.53 | −0.17 | 64.36 | −1.32 | 0.21 | ||
| 63.80 | 61.63 | 66.01 | 4.38 | 58.20 | 4.85 | 63.05 | 1.69 | 64.74 | −0.63 | 64.11 | −0.32 | 63.80 | −0.94 | 0.75 | ||
| 63.52 | 62.12 | 64.94 | 2.81 | 53.68 | 9.27 | 62.95 | −0.20 | 62.75 | 1.04 | 63.78 | −0.27 | 63.52 | 0.77 | 0.57 | ||
| 63.42 | 61.24 | 65.83 | 4.58 | 58.76 | 3.76 | 62.52 | 1.55 | 64.07 | 0.10 | 64.17 | −0.75 | 63.42 | −0.65 | 0.90 | ||
| 62.90 | 59.49 | 66.47 | 6.98 | 44.52 | 16.38 | 60.90 | 3.22 | 64.12 | −0.40 | 63.72 | −0.81 | 62.90 | −1.21 | 2.01 | ||
| 62.70 | 60.42 | 64.92 | 4.50 | 48.34 | 12.07 | 60.41 | 2.58 | 62.99 | −0.14 | 62.85 | −0.15 | 62.70 | −0.29 | 2.30 | ||
| 62.34 | 59.46 | 65.00 | 5.54 | 58.47 | 4.91 | 63.38 | 2.79 | 66.17 | −0.92 | 65.25 | −2.91 | 62.34 | −3.83 | −1.04 | ||
| 62.30 | 59.73 | 65.02 | 5.29 | 56.57 | 5.07 | 61.64 | 1.44 | 63.09 | −0.39 | 62.69 | −0.39 | 62.30 | −0.78 | 0.66 | ||
| 62.08 | 60.66 | 63.53 | 2.87 | 56.94 | 5.33 | 62.27 | 1.49 | 63.76 | −1.14 | 62.61 | −0.53 | 62.08 | −1.67 | −0.19 | ||
| 61.66 | 59.71 | 63.61 | 3.90 | 47.51 | 12.35 | 59.87 | 2.48 | 62.35 | −0.78 | 61.57 | 0.10 | 61.66 | −0.69 | 1.79 | ||
| 61.64 | 59.03 | 64.31 | 5.28 | 46.02 | 14.02 | 60.04 | 2.41 | 62.45 | −0.19 | 62.26 | −0.62 | 61.64 | −0.80 | 1.60 | ||
| 61.62 | 60.85 | 62.39 | 1.54 | 54.74 | 4.11 | 58.85 | 2.05 | 60.90 | 0.13 | 61.03 | 0.58 | 61.62 | 0.72 | 2.77 | ||
| 61.58 | 60.41 | 62.79 | 2.39 | 49.32 | 11.46 | 60.79 | 2.11 | 62.90 | −1.45 | 61.45 | 0.12 | 61.58 | −1.32 | 0.79 | ||
| 61.43 | 58.94 | 64.09 | 5.16 | 54.41 | 7.41 | 61.82 | 1.13 | 62.94 | −0.27 | 62.67 | −1.25 | 61.43 | −1.52 | −0.39 | ||
| 61.22 | 58.49 | 63.93 | 5.44 | 45.23 | 15.47 | 60.70 | 2.09 | 62.79 | −0.41 | 62.38 | −1.16 | 61.22 | −1.57 | 0.52 | ||
| 61.14 | 58.69 | 63.59 | 4.90 | 51.01 | 11.60 | 62.61 | 2.86 | 65.46 | 0.18 | 65.65 | −4.51 | 61.14 | −4.32 | −1.47 | ||
| 60.75 | 59.41 | 62.07 | 2.66 | 51.36 | 7.77 | 59.12 | 1.98 | 61.10 | −0.16 | 60.95 | −0.20 | 60.75 | −0.36 | 1.63 | ||
| 60.59 | 58.78 | 62.73 | 3.95 | 53.23 | 6.37 | 59.59 | 2.05 | 61.64 | −0.94 | 60.71 | −0.11 | 60.59 | −1.05 | 1.00 | ||
| 60.33 | 58.69 | 62.02 | 3.33 | 52.93 | 6.00 | 58.94 | 2.65 | 61.58 | −0.75 | 60.83 | −0.50 | 60.33 | −1.25 | 1.40 | ||
| 60.06 | 58.76 | 61.35 | 2.60 | 45.05 | 11.34 | 56.39 | 3.86 | 60.26 | −0.49 | 59.76 | 0.30 | 60.06 | −0.19 | 3.67 | ||
| 59.82 | 58.22 | 61.45 | 3.22 | 56.58 | 2.55 | 59.12 | 1.33 | 60.45 | −0.37 | 60.09 | −0.27 | 59.82 | −0.63 | 0.70 | ||
| 59.65 | 57.39 | 61.80 | 4.40 | 50.12 | 8.49 | 58.61 | 2.27 | 60.88 | −0.88 | 60.00 | −0.35 | 59.65 | −1.23 | 1.04 | ||
| 59.33 | 56.20 | 62.43 | 6.23 | 49.49 | 7.78 | 57.27 | 3.89 | 61.17 | 0.01 | 61.17 | −1.85 | 59.33 | −1.84 | 2.05 | ||
| 59.27 | 57.47 | 60.99 | 3.52 | 50.85 | 7.51 | 58.36 | 1.68 | 60.04 | −0.31 | 59.73 | −0.46 | 59.27 | −0.77 | 0.91 | ||
| 59.27 | 55.72 | 62.98 | 7.26 | 51.99 | 7.83 | 59.82 | 3.25 | 63.08 | −0.25 | 62.83 | −3.56 | 59.27 | −3.81 | −0.55 | ||
| 59.25 | 56.23 | 62.05 | 5.81 | 44.69 | 14.16 | 58.85 | 2.45 | 61.29 | −0.17 | 61.12 | −1.87 | 59.25 | −2.04 | 0.41 | ||
| 59.19 | 56.95 | 61.52 | 4.57 | 51.78 | 6.52 | 58.30 | 1.98 | 60.28 | −0.54 | 59.74 | −0.55 | 59.19 | −1.08 | 0.90 | ||
| 58.94 | 57.62 | 60.33 | 2.71 | 50.54 | 7.36 | 57.90 | 1.76 | 59.66 | −1.03 | 58.63 | 0.31 | 58.94 | −0.72 | 1.04 | ||
| 58.89 | 57.59 | 60.10 | 2.50 | 52.48 | 5.41 | 57.89 | 1.83 | 59.72 | −0.39 | 59.33 | −0.43 | 58.89 | −0.83 | 1.01 | ||
| 58.60 | 57.40 | 59.94 | 2.54 | 50.84 | 6.37 | 57.21 | 2.11 | 59.32 | −0.29 | 59.03 | −0.43 | 58.60 | −0.72 | 1.39 | ||
| 57.07 | 53.37 | 61.25 | 7.88 | 47.26 | 5.79 | 53.05 | 7.50 | 60.55 | −0.86 | 59.69 | −2.63 | 57.07 | −3.48 | 4.02 | ||
| 55.28 | 53.25 | 57.41 | 4.17 | 50.66 | 3.62 | 54.28 | 2.80 | 57.08 | −1.11 | 55.97 | −0.69 | 55.28 | −1.80 | 1.00 | ||
| 54.98 | 53.43 | 56.47 | 3.04 | 46.03 | 8.95 | 54.97 | 0.94 | 55.91 | −0.43 | 55.48 | −0.50 | 54.98 | −0.94 | 0.00 | ||
| 53.90 | 51.65 | 56.30 | 4.66 | 45.41 | 5.16 | 50.57 | 4.46 | 55.02 | −0.42 | 54.60 | −0.71 | 53.90 | −1.13 | 3.33 | ||
| 53.06 | 50.37 | 55.93 | 5.55 | 48.43 | 1.61 | 50.03 | 4.14 | 54.17 | 0.52 | 54.69 | −1.63 | 53.06 | −1.11 | 3.03 | ||
| 52.68 | 52.28 | 53.07 | 0.79 | 47.19 | 4.60 | 51.79 | 1.12 | 52.91 | −0.02 | 52.89 | −0.21 | 52.68 | −0.23 | 0.89 | ||
| 52.52 | 50.84 | 54.28 | 3.44 | 47.44 | 3.76 | 51.20 | 2.06 | 53.26 | −0.48 | 52.78 | −0.25 | 52.52 | −0.73 | 1.32 | ||

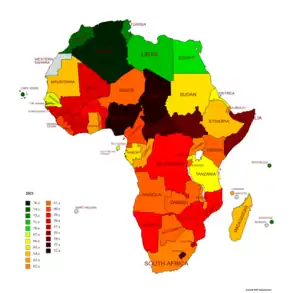
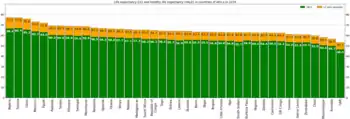
Change in life expectancy in Africa from 2019 to 2021[1]
United Nations (2021)
Estimation of the analytical agency of the UN for 2019 and 2021.[4][5][6] By default, the list is sorted by 2021.
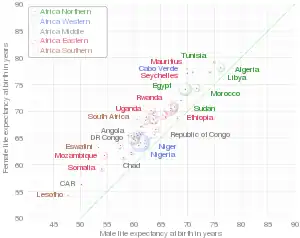
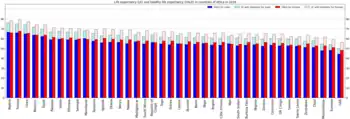
Interactive chart of male and female life expectancy in Africa as defined by WHO for 2019. Open the original chart and hover over chart elements. The squares of bubbles are proportional to population according to estimation of the UN for 2019.
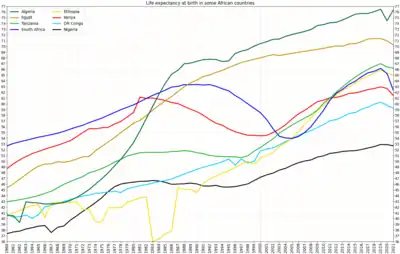
Comparison of life expectancy in some African countries since 1960[1]
Life expectancy and HALE in countries of Africa in 2019[7]
Elaboration by gender[7]
| Countries & territories |
2019 | 2021 | 2019 →2021 | ||||||
|---|---|---|---|---|---|---|---|---|---|
| All | Male | Female | Gender gap |
All | Male | Female | Gender gap | ||
| 76.9 | 75.7 | 78.1 | 2.4 | 76.4 | 74.9 | 78.0 | 3.1 | −0.5 | |
| 73.0 | 69.5 | 76.2 | 6.7 | 74.1 | 69.6 | 78.5 | 8.9 | 1.1 | |
| 76.7 | 75.4 | 77.9 | 2.5 | 74.0 | 71.9 | 76.4 | 4.5 | −2.7 | |
| 76.7 | 74.7 | 78.7 | 4.0 | 73.8 | 70.7 | 77.1 | 6.4 | −2.9 | |
| 75.0 | 71.7 | 78.5 | 6.8 | 73.6 | 70.4 | 76.8 | 6.4 | −1.4 | |
| 72.9 | 70.1 | 76.0 | 5.9 | 71.9 | 69.6 | 74.4 | 4.8 | −1.0 | |
| World | 72.8 | 70.6 | 75.0 | 4.4 | 71.4 | 68.9 | 74.0 | 5.1 | −1.4 |
| 73.4 | 69.9 | 77.4 | 7.5 | 71.3 | 67.7 | 75.7 | 8.0 | −2.1 | |
| 72.0 | 69.7 | 74.4 | 4.7 | 70.2 | 67.9 | 72.6 | 4.7 | −1.8 | |
| 70.4 | 68.0 | 72.8 | 4.8 | 67.6 | 65.2 | 70.4 | 5.2 | −2.8 | |
| 67.9 | 65.8 | 69.9 | 4.1 | 67.1 | 64.8 | 69.3 | 4.5 | −0.8 | |
| 66.3 | 64.2 | 68.6 | 4.4 | 66.5 | 64.3 | 68.7 | 4.4 | 0.2 | |
| 65.5 | 63.6 | 67.2 | 3.6 | 66.2 | 64.2 | 68.3 | 4.1 | 0.7 | |
| 69.0 | 66.8 | 71.1 | 4.3 | 66.1 | 63.8 | 68.2 | 4.4 | −2.9 | |
| 66.5 | 64.4 | 68.7 | 4.3 | 65.8 | 63.5 | 68.5 | 5.0 | −0.7 | |
| 65.3 | 63.5 | 67.2 | 3.7 | 65.3 | 62.7 | 67.9 | 5.2 | 0.0 | |
| 66.6 | 64.7 | 68.5 | 3.8 | 65.0 | 61.9 | 68.3 | 6.4 | −1.6 | |
| 67.0 | 65.4 | 68.7 | 3.3 | 64.5 | 62.2 | 66.9 | 4.7 | −2.5 | |
| 64.9 | 63.3 | 66.5 | 3.2 | 64.4 | 62.7 | 66.1 | 3.4 | −0.5 | |
| 64.1 | 63.0 | 65.2 | 2.2 | 63.8 | 61.6 | 66.0 | 4.4 | −0.3 | |
| 64.6 | 63.1 | 66.0 | 2.9 | 63.5 | 62.1 | 64.9 | 2.8 | −1.1 | |
| 64.3 | 62.6 | 66.1 | 3.5 | 63.4 | 61.2 | 65.8 | 4.6 | −0.9 | |
| 64.3 | 61.1 | 67.4 | 6.3 | 62.9 | 59.5 | 66.5 | 7.0 | −1.4 | |
| 63.4 | 61.0 | 65.6 | 4.6 | 62.7 | 60.4 | 64.9 | 4.5 | −0.7 | |
| 67.1 | 65.1 | 69.4 | 4.3 | 62.3 | 59.7 | 65.0 | 5.3 | −4.8 | |
| 64.1 | 60.7 | 67.7 | 7.0 | 62.3 | 59.5 | 65.0 | 5.5 | −1.8 | |
| 62.1 | 60.7 | 63.5 | 2.8 | 62.1 | 60.7 | 63.5 | 2.8 | 0.0 | |
| 61.6 | 59.8 | 63.4 | 3.6 | 61.7 | 59.7 | 63.6 | 3.9 | 0.1 | |
| 61.0 | 60.2 | 61.9 | 1.7 | 61.6 | 60.8 | 62.4 | 1.6 | 0.6 | |
| 62.4 | 61.3 | 63.6 | 2.3 | 61.6 | 60.4 | 62.8 | 2.4 | −0.8 | |
| 61.2 | 58.4 | 64.0 | 5.6 | 61.6 | 59.0 | 64.3 | 5.3 | 0.4 | |
| 66.7 | 64.3 | 69.0 | 4.7 | 61.4 | 58.9 | 64.1 | 5.2 | −5.3 | |
| 63.9 | 60.8 | 66.9 | 6.1 | 61.2 | 58.5 | 63.9 | 5.4 | −2.7 | |
| 69.6 | 66.5 | 72.4 | 5.9 | 61.1 | 58.7 | 63.6 | 4.9 | −8.5 | |
| 64.1 | 62.7 | 65.5 | 2.8 | 60.7 | 59.4 | 62.1 | 2.7 | −3.4 | |
| 58.7 | 57.7 | 59.9 | 2.2 | 60.6 | 58.8 | 62.7 | 3.9 | 1.9 | |
| 59.3 | 58.0 | 60.6 | 2.6 | 60.3 | 58.7 | 62.0 | 3.3 | 1.0 | |
| 54.7 | 53.9 | 55.5 | 1.6 | 60.1 | 58.8 | 61.4 | 2.6 | 5.4 | |
| 61.8 | 60.2 | 63.3 | 3.1 | 59.8 | 58.2 | 61.4 | 3.2 | −2.0 | |
| 58.3 | 56.3 | 60.2 | 3.9 | 59.7 | 57.4 | 61.8 | 4.4 | 1.4 | |
| 61.6 | 60.7 | 62.3 | 1.6 | 59.3 | 57.5 | 61.0 | 3.5 | −2.3 | |
| 60.9 | 57.8 | 63.7 | 5.9 | 59.3 | 56.2 | 62.4 | 6.2 | −1.6 | |
| 61.5 | 59.8 | 62.9 | 3.1 | 59.3 | 56.2 | 62.0 | 5.8 | −2.2 | |
| 63.7 | 60.7 | 66.5 | 5.8 | 59.3 | 55.7 | 63.0 | 7.3 | −4.4 | |
| 60.7 | 59.1 | 62.2 | 3.1 | 59.2 | 57.0 | 61.5 | 4.5 | −1.5 | |
| 59.3 | 58.5 | 60.1 | 1.6 | 58.9 | 57.6 | 60.3 | 2.7 | −0.4 | |
| 61.6 | 60.9 | 62.1 | 1.2 | 58.9 | 57.6 | 60.1 | 2.5 | −2.7 | |
| 57.8 | 56.6 | 59.1 | 2.5 | 58.6 | 57.4 | 59.9 | 2.5 | 0.8 | |
| 60.2 | 56.0 | 64.8 | 8.8 | 57.1 | 53.4 | 61.2 | 7.8 | −3.1 | |
| 57.4 | 55.7 | 59.1 | 3.4 | 55.3 | 53.2 | 57.4 | 4.2 | −2.1 | |
| 57.9 | 56.4 | 59.4 | 3.0 | 55.0 | 53.4 | 56.5 | 3.1 | −2.9 | |
| 53.3 | 51.1 | 55.5 | 4.4 | 53.9 | 51.6 | 56.3 | 4.7 | 0.6 | |
| 54.3 | 51.2 | 57.6 | 6.4 | 53.1 | 50.4 | 55.9 | 5.5 | −1.2 | |
| 54.7 | 53.8 | 55.6 | 1.8 | 52.7 | 52.3 | 53.1 | 0.8 | −2.0 | |
| 54.2 | 52.8 | 55.7 | 2.9 | 52.5 | 50.8 | 54.3 | 3.5 | −1.7 | |
WHO (2019)
Estimation of the World Health Organization for 2019.[7][8]
| Countries | Life expectancy at birth | HALE at birth | Life expectancy at age 60 | HALE at age 60 | |||||||||||||||||
|---|---|---|---|---|---|---|---|---|---|---|---|---|---|---|---|---|---|---|---|---|---|
| All | M | F | FΔM | Δ 2000 |
All | M | F | FΔM | Δ 2000 |
All | M | F | FΔM | Δ 2000 |
All | M | F | FΔM | Δ 2000 | ||
| 77.1 | 76.2 | 78.1 | 1.9 | 4.9 | 66.4 | 66.7 | 66.1 | -0.6 | 3.7 | 22.0 | 21.5 | 22.6 | 1.1 | 2.2 | 16.0 | 15.9 | 16.2 | 0.3 | 1.4 | ||
| 77.0 | 74.9 | 79.2 | 4.3 | 2.9 | 66.9 | 66.1 | 67.7 | 1.6 | 2.1 | 21.5 | 20.2 | 22.8 | 2.6 | 1.4 | 16.0 | 15.1 | 16.8 | 1.7 | 0.9 | ||
| 75.8 | 74.2 | 77.3 | 3.1 | 1.4 | 65.2 | 64.9 | 65.5 | 0.6 | 0.6 | 21.3 | 20.5 | 21.9 | 1.4 | 0.3 | 15.5 | 15.3 | 15.8 | 0.5 | -0.1 | ||
| 74.1 | 71.0 | 77.3 | 6.3 | 2.9 | 63.9 | 62.0 | 65.9 | 3.9 | 2.0 | 20.3 | 18.5 | 22.0 | 3.5 | 2.5 | 14.5 | 13.3 | 15.6 | 2.3 | 1.6 | ||
| 74.0 | 69.9 | 77.9 | 8.0 | 3.0 | 64.8 | 62.2 | 67.2 | 5.0 | 2.8 | 19.7 | 16.8 | 21.8 | 5.0 | -0.7 | 14.9 | 13.0 | 16.3 | 3.3 | -0.5 | ||
| 73.3 | 70.0 | 77.1 | 7.1 | 1.4 | 64.0 | 61.9 | 66.4 | 4.5 | 0.9 | 19.5 | 17.5 | 21.5 | 4.0 | 0.5 | 14.1 | 12.7 | 15.4 | 2.7 | 0.2 | ||
| World | 73.3 | 70.8 | 75.9 | 5.1 | 6.5 | 63.7 | 62.5 | 64.9 | 2.4 | 5.4 | 21.1 | 19.5 | 22.7 | 3.2 | 2.3 | 15.8 | 14.8 | 16.6 | 1.8 | 1.7 | |
| 73.0 | 71.7 | 74.3 | 2.6 | 3.7 | 63.7 | 63.7 | 63.7 | 0.0 | 3.0 | 18.7 | 17.7 | 19.6 | 1.9 | 0.3 | 14.1 | 13.7 | 14.6 | 0.9 | 0.0 | ||
| 71.8 | 69.6 | 74.1 | 4.5 | 2.0 | 63.0 | 62.3 | 63.7 | 1.4 | 1.8 | 17.8 | 16.5 | 19.1 | 2.6 | -0.7 | 13.4 | 12.7 | 14.0 | 1.3 | -0.5 | ||
| 70.4 | 68.8 | 72.0 | 3.2 | 6.9 | 61.6 | 60.9 | 62.2 | 1.3 | 6.0 | 17.7 | 16.7 | 18.6 | 1.9 | 0.6 | 13.1 | 12.6 | 13.7 | 1.1 | 0.5 | ||
| 69.1 | 66.9 | 71.2 | 4.3 | 21.6 | 60.2 | 59.0 | 61.4 | 2.4 | 19.0 | 18.0 | 16.6 | 19.2 | 2.6 | 4.6 | 13.6 | 12.7 | 14.4 | 1.7 | 3.6 | ||
| 69.1 | 67.6 | 70.8 | 3.2 | 6.6 | 59.9 | 59.6 | 60.3 | 0.7 | 5.6 | 18.6 | 17.8 | 19.4 | 1.6 | 1.3 | 13.6 | 13.3 | 14.0 | 0.7 | 1.0 | ||
| 68.7 | 66.9 | 70.5 | 3.6 | 18.1 | 59.9 | 59.0 | 60.8 | 1.8 | 15.6 | 18.4 | 17.4 | 19.4 | 2.0 | 4.3 | 13.9 | 13.3 | 14.4 | 1.1 | 3.3 | ||
| 68.6 | 66.8 | 70.1 | 3.3 | 10.0 | 59.4 | 58.8 | 59.9 | 1.1 | 8.6 | 18.1 | 17.2 | 18.9 | 1.7 | 1.5 | 13.1 | 12.6 | 13.5 | 0.9 | 1.1 | ||
| 68.4 | 68.1 | 68.7 | 0.6 | 6.4 | 59.8 | 60.2 | 59.4 | -0.8 | 5.4 | 19.0 | 19.1 | 18.9 | -0.2 | 1.9 | 14.3 | 14.6 | 14.1 | -0.5 | 1.5 | ||
| 67.4 | 65.9 | 68.9 | 3.0 | 5.9 | 58.9 | 58.3 | 59.6 | 1.3 | 5.1 | 18.1 | 17.4 | 18.8 | 1.4 | 1.8 | 13.7 | 13.2 | 14.1 | 0.9 | 1.4 | ||
| 67.3 | 65.4 | 69.3 | 3.9 | 14.8 | 58.5 | 57.6 | 59.3 | 1.7 | 13.1 | 18.2 | 17.1 | 19.1 | 2.0 | 2.2 | 13.4 | 12.7 | 13.9 | 1.2 | 1.7 | ||
| 66.7 | 63.2 | 70.1 | 6.9 | 17.9 | 58.2 | 56.0 | 60.4 | 4.4 | 15.7 | 17.7 | 15.7 | 19.4 | 3.7 | 3.0 | 13.4 | 12.0 | 14.6 | 2.6 | 2.3 | ||
| 66.5 | 63.6 | 69.7 | 6.1 | 8.4 | 57.6 | 56.0 | 59.3 | 3.3 | 7.1 | 17.2 | 15.2 | 19.3 | 4.1 | 2.0 | 12.8 | 11.4 | 14.2 | 2.8 | 1.5 | ||
| 66.3 | 63.7 | 69.2 | 5.5 | 7.1 | 58.0 | 56.5 | 59.6 | 3.1 | 6.1 | 17.2 | 15.7 | 18.9 | 3.2 | 1.2 | 12.9 | 11.9 | 14.0 | 2.1 | 0.9 | ||
| 66.1 | 63.7 | 68.4 | 4.7 | 12.2 | 57.7 | 56.4 | 58.9 | 2.5 | 10.8 | 17.6 | 16.0 | 19.1 | 3.1 | 1.3 | 13.1 | 11.9 | 14.0 | 2.1 | 1.3 | ||
| 65.8 | 64.1 | 67.8 | 3.7 | 6.0 | 58.0 | 57.2 | 58.9 | 1.7 | 5.3 | 17.8 | 16.6 | 19.0 | 2.4 | 1.5 | 13.6 | 12.9 | 14.4 | 1.5 | 1.1 | ||
| 65.6 | 62.3 | 68.9 | 6.6 | 20.9 | 57.1 | 55.1 | 59.0 | 3.9 | 18.0 | 17.2 | 15.1 | 19.0 | 3.9 | 3.2 | 12.8 | 11.3 | 14.0 | 2.7 | 2.5 | ||
| 65.5 | 63.4 | 67.7 | 4.3 | 6.3 | 57.0 | 56.4 | 57.7 | 1.3 | 5.3 | 16.9 | 15.8 | 18.0 | 2.2 | 0.7 | 12.6 | 12.1 | 13.2 | 1.1 | 0.4 | ||
| 65.3 | 64.1 | 66.6 | 2.5 | 6.5 | 57.3 | 56.9 | 57.7 | 0.8 | 6.0 | 16.8 | 16.1 | 17.3 | 1.2 | 1.4 | 12.6 | 12.3 | 12.9 | 0.6 | 1.1 | ||
| 65.3 | 62.2 | 68.3 | 6.1 | 9.5 | 56.2 | 54.6 | 57.7 | 3.1 | 7.7 | 19.1 | 17.3 | 20.5 | 3.2 | 2.9 | 13.9 | 12.7 | 14.8 | 2.1 | 2.0 | ||
| 64.7 | 63.8 | 65.6 | 1.8 | 12.6 | 56.2 | 56.4 | 56.1 | -0.3 | 10.8 | 16.4 | 15.7 | 17.1 | 1.4 | 2.5 | 12.2 | 11.9 | 12.5 | 0.6 | 1.9 | ||
| 64.6 | 60.6 | 68.4 | 7.8 | 11.3 | 56.1 | 53.4 | 58.6 | 5.2 | 9.5 | 17.2 | 14.7 | 19.3 | 4.6 | 2.6 | 12.7 | 10.8 | 14.2 | 3.4 | 1.9 | ||
| Africa[9] | 64.5 | 62.4 | 66.6 | 4.2 | 11.8 | 56.0 | 55.0 | 57.1 | 2.1 | 10.2 | 17.9 | 16.7 | 19.0 | 2.3 | 2.4 | 13.3 | 12.6 | 13.9 | 1.3 | 1.8 | |
| 64.3 | 61.5 | 67.2 | 5.7 | 8.4 | 56.2 | 54.7 | 57.8 | 3.1 | 7.3 | 17.0 | 15.4 | 18.6 | 3.2 | 1.3 | 12.8 | 11.8 | 13.8 | 2.0 | 1.1 | ||
| 64.1 | 61.3 | 67.1 | 5.8 | 9.6 | 55.7 | 53.9 | 57.7 | 3.8 | 8.7 | 15.5 | 14.1 | 16.8 | 2.7 | 2.0 | 11.4 | 10.4 | 12.4 | 2.0 | 1.5 | ||
| 64.1 | 63.2 | 65.0 | 1.8 | 10.3 | 54.9 | 54.9 | 55.0 | 0.1 | 9.1 | 17.7 | 17.4 | 18.0 | 0.6 | 1.9 | 12.9 | 12.8 | 12.9 | 0.1 | 1.5 | ||
| 63.8 | 61.5 | 66.1 | 4.6 | 20.0 | 55.6 | 54.0 | 57.2 | 3.2 | 17.5 | 16.5 | 15.2 | 17.6 | 2.4 | 3.5 | 12.7 | 11.8 | 13.5 | 1.7 | 2.8 | ||
| 63.4 | 61.2 | 65.7 | 4.5 | 6.8 | 55.5 | 54.5 | 56.6 | 2.1 | 5.9 | 17.4 | 16.1 | 18.5 | 2.4 | 1.3 | 13.0 | 12.3 | 13.7 | 1.4 | 0.9 | ||
| 63.3 | 62.1 | 64.6 | 2.5 | 12.9 | 55.5 | 55.3 | 55.8 | 0.5 | 11.3 | 17.2 | 16.6 | 17.8 | 1.2 | 1.4 | 13.0 | 12.7 | 13.3 | 0.6 | 1.0 | ||
| 63.1 | 60.7 | 65.5 | 4.8 | 13.8 | 54.8 | 53.6 | 56.2 | 2.6 | 11.9 | 17.0 | 15.4 | 18.6 | 3.2 | 2.6 | 12.6 | 11.6 | 13.7 | 2.1 | 1.9 | ||
| 62.9 | 60.5 | 65.8 | 5.3 | 12.6 | 54.8 | 53.4 | 56.5 | 3.1 | 10.8 | 17.1 | 15.8 | 18.7 | 2.9 | 2.6 | 12.7 | 11.9 | 13.7 | 1.8 | 2.0 | ||
| 62.8 | 62.2 | 63.4 | 1.2 | 10.2 | 54.6 | 54.8 | 54.5 | -0.3 | 9.0 | 17.5 | 17.3 | 17.6 | 0.3 | 1.5 | 12.8 | 12.9 | 12.7 | -0.2 | 1.1 | ||
| 62.8 | 60.8 | 64.8 | 4.0 | 8.7 | 53.7 | 52.9 | 54.5 | 1.6 | 7.3 | 17.8 | 16.6 | 18.9 | 2.3 | 1.5 | 12.7 | 12.2 | 13.1 | 0.9 | 1.1 | ||
| 62.7 | 60.1 | 65.2 | 5.1 | 11.1 | 54.9 | 53.4 | 56.3 | 2.9 | 10.0 | 16.8 | 15.2 | 18.1 | 2.9 | 1.3 | 12.6 | 11.6 | 13.4 | 1.8 | 1.1 | ||
| 62.6 | 61.2 | 64.1 | 2.9 | 9.0 | 54.4 | 53.9 | 54.9 | 1.0 | 7.9 | 18.2 | 17.6 | 18.9 | 1.3 | 2.0 | 13.5 | 13.3 | 13.8 | 0.5 | 1.5 | ||
| 62.5 | 59.5 | 65.4 | 5.9 | 18.0 | 54.4 | 52.5 | 56.3 | 3.8 | 15.4 | 16.5 | 14.7 | 18.0 | 3.3 | 3.3 | 12.6 | 11.3 | 13.7 | 2.4 | 2.6 | ||
| 62.4 | 60.3 | 64.5 | 4.2 | 9.6 | 54.5 | 53.5 | 55.6 | 2.1 | 8.4 | 17.1 | 15.8 | 18.3 | 2.5 | 2.0 | 12.8 | 12.0 | 13.5 | 1.5 | 1.7 | ||
| 62.4 | 60.0 | 64.8 | 4.8 | 10.0 | 54.1 | 52.8 | 55.4 | 2.6 | 8.8 | 16.6 | 15.4 | 17.9 | 2.5 | 1.7 | 12.5 | 11.7 | 13.4 | 1.7 | 1.3 | ||
| 62.2 | 60.9 | 63.6 | 2.7 | 7.9 | 53.9 | 53.4 | 54.1 | 0.7 | 7.1 | 17.6 | 16.5 | 18.8 | 2.3 | 2.1 | 12.9 | 12.3 | 13.6 | 1.3 | 1.7 | ||
| 62.2 | 58.9 | 65.5 | 6.6 | 16.6 | 53.9 | 51.9 | 55.8 | 3.9 | 13.8 | 16.2 | 14.2 | 18.0 | 3.8 | 3.3 | 11.8 | 10.3 | 13.1 | 2.8 | 2.4 | ||
| 61.0 | 59.5 | 62.3 | 2.8 | 6.7 | 53.3 | 52.9 | 53.7 | 0.8 | 5.8 | 16.5 | 15.6 | 17.2 | 1.6 | 0.8 | 12.3 | 11.8 | 12.6 | 0.8 | 0.6 | ||
| 60.8 | 59.6 | 61.9 | 2.3 | 12.1 | 52.9 | 52.5 | 53.3 | 0.8 | 10.7 | 17.0 | 16.4 | 17.4 | 1.0 | 1.6 | 12.6 | 12.4 | 12.8 | 0.4 | 1.3 | ||
| 60.7 | 57.5 | 63.6 | 6.1 | 14.1 | 53.1 | 51.2 | 54.8 | 3.6 | 12.1 | 15.6 | 13.6 | 17.0 | 3.4 | 1.2 | 11.5 | 10.2 | 12.4 | 2.2 | 0.9 | ||
| 60.2 | 57.4 | 63.0 | 5.6 | 9.9 | 52.6 | 51.1 | 54.1 | 3.0 | 8.6 | 15.5 | 13.9 | 16.7 | 2.8 | 1.7 | 11.4 | 10.5 | 12.1 | 1.6 | 1.3 | ||
| 59.6 | 58.0 | 61.3 | 3.3 | 8.5 | 52.0 | 51.3 | 52.8 | 1.5 | 7.3 | 16.5 | 15.7 | 17.3 | 1.6 | 1.6 | 12.3 | 11.8 | 12.7 | 0.9 | 1.2 | ||
| 58.1 | 54.5 | 61.7 | 7.2 | 7.4 | 50.4 | 47.9 | 52.8 | 4.9 | 6.8 | 15.8 | 13.3 | 17.8 | 4.5 | 0.6 | 11.6 | 9.8 | 13.0 | 3.2 | 0.6 | ||
| 57.7 | 53.4 | 63.2 | 9.8 | 10.7 | 50.1 | 47.1 | 53.8 | 6.7 | 8.8 | 15.1 | 12.4 | 17.7 | 5.3 | 1.5 | 11.0 | 9.0 | 12.9 | 3.9 | 1.1 | ||
| 56.5 | 54.0 | 59.2 | 5.2 | 6.6 | 49.7 | 48.3 | 51.3 | 3.0 | 5.7 | 14.5 | 13.2 | 16.0 | 2.8 | 1.4 | 11.2 | 10.3 | 12.2 | 1.9 | 1.1 | ||
| 53.1 | 50.2 | 56.3 | 6.1 | 8.8 | 46.4 | 44.5 | 48.4 | 3.9 | 7.7 | 13.2 | 11.3 | 14.9 | 3.6 | 1.4 | 10.0 | 8.6 | 11.1 | 2.5 | 1.1 | ||
| 50.7 | 47.7 | 54.2 | 6.5 | 2.9 | 44.2 | 42.3 | 46.4 | 4.1 | 2.2 | 13.4 | 11.2 | 15.2 | 4.0 | -0.5 | 9.8 | 8.3 | 11.0 | 2.7 | -0.5 | ||
See also
References
- 1 2 3 "Life expectancy at birth, total". The World Bank Group. 29 June 2023. Retrieved 6 July 2023.
- ↑ "Life expectancy at birth, male". The World Bank Group. 29 June 2023. Retrieved 6 July 2023.
- ↑ "Life expectancy at birth, female". The World Bank Group. 29 June 2023. Retrieved 6 July 2023.
- ↑ "Human Development Report 2020 (tables 1 and 4)" (PDF). UN Development Programme. Archived from the original (PDF) on 15 December 2020. Retrieved 28 February 2021.
- ↑ "Human Development Report 2021/2022 (tables 1 and 4)" (PDF). UN Development Programme. Retrieved 28 June 2023.
- ↑ "Population & Demography Data Explorer". Retrieved 3 July 2023.
- 1 2 3 "Life expectancy and Healthy life expectancy, data by country". World Health Organization. 4 December 2022.
- ↑ "Life expectancy and Healthy life expectancy, data by WHO region". World Health Organization. 7 December 2022.
- ↑ "WHO: Africa: Countries". World Health Organization. Retrieved 7 May 2022.
This article is issued from Wikipedia. The text is licensed under Creative Commons - Attribution - Sharealike. Additional terms may apply for the media files.