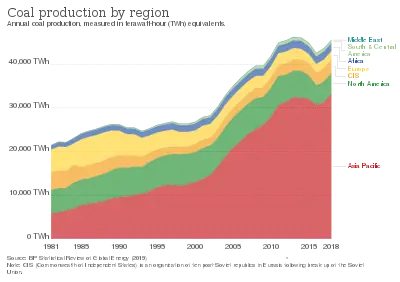
Coal production by region
This is a list of countries by coal production ranking countries with coal production larger than 5 million tonnes as of 2021.
| Country | 2021[1] | 2020[1] | 2019[1] | 2018[2] | 2017[3] | 2016[4] | 2015[5] | 2014[6] | 2013[4] | 2007[7] |
|---|---|---|---|---|---|---|---|---|---|---|
| 4,126.0 | 3,901.6 | 3,846.3 | 3,697.7 | 3,523.2 | 3,411.0 | 3,747.0 | 3,874.0 | 3,974.3 | 2,536.7 | |
| 762.0 | 719.8 | 730.3 | 760.4 | 716.0 | 692.4 | 677.5 | 648.1 | 608.5 | 478.2 | |
| 614.0 | 563.7 | 616.2 | 557.8 | 461.0 | 434.0 | 392.0 | 458.0 | 474.6 | 174.8 | |
| 523.8 | 485.7 | 640.8 | 686.0 | 702.3 | 660.6 | 812.8 | 906.9 | 893.4 | 1,039.2 | |
| 467.1 | 499.8 | 511.7 | 502.0 | 481.3 | 492.8 | 484.5 | 503.2 | 472.8 | 393.9 | |
| 435.3 | 401.4 | 437.0 | 441.6 | 411.2 | 385.4 | 373.3 | 357.6 | 355.2 | 314.2 | |
| 235.7 | 247.1 | 257.9 | 250.0 | 252.3 | 251.2 | 252.1 | 260.5 | 256.3 | 269.4 | |
| 126.3 | 107.4 | 131.3 | 168.8 | 175.1 | 176.1 | 183.3 | 185.8 | 190.6 | 201.9 | |
| 107.4 | 100.4 | 112.0 | 122.4 | 127.1 | 131.1 | 135.5 | 137.1 | 142.9 | 145.8 | |
| 89.1 | 103.3 | 104.5 | 118.5 | 111.1 | 102.4 | 106.5 | 108.7 | 119.6 | 94.4 | |
| 85.6 | 74.7 | 87.1 | 83.9 | 99.8 | 70.6 | 58.4 | 65.2 | 60.4 | 76.6 | |
| 56.2 | 49.3 | 84.3 | 84.3 | 89.4 | 90.5 | 85.5 | 88.6 | 85.5 | 71.7 | |
| 47.8 | 43.9 | 45.7 | 42.4 | 38.1 | 39.4 | 41.5 | 41.2 | 41.1 | 41.2 | |
| 47.5 | 45.3 | 53.2 | 55.0 | 59.5 | 60.3 | 60.7 | 68.8 | 68.4 | 69.4 | |
| 36.4 | 39.7 | 38.9 | 37.7 | 40.0 | 38.4 | 38.1 | 29.8 | 40.3 | 37.7 | |
| 34.6 | 43.8 | 55.8 | 54.6 | 49.5 | 38.1 | 24.5 | 25.3 | 30.1 | 9.2 | |
| 31.5 | 31.6 | 40.9 | 43.8 | 44.9 | 46.0 | 46.2 | 46.9 | 49.0 | 62.6 | |
| 28.3 | 22.3 | 28.0 | 30.9 | 34.5 | 31.5 | 35.9 | 31.3 | 28.6 | 30.4 | |
| 24.9 | 24.4 | 26.1 | 26.8 | 34.2 | 41.8 | 38.5 | 60.9 | 84.8 | 76.3 | |
| 17.7 | 15.0 | 21.7 | 23.7 | 25.7 | 23.2 | 25.5 | 23.6 | 24.7 | 35.4 | |
| 16.7 | 19.0 | 20.2 | 18.1 | 21.8 | 32.0 | 27.5 | 25.7 | 25.6 | ||
| 14.4 | 13.3 | 15.3 | 14.4 | 13.1 | 12.3 | 7.8 | 10.5 | 7.8 | ||
| 14.3 | 14.7 | 15.4 | 17.7 | 14.9 | 14.6 | 5.3 | 1.3 | 1.1 | 0.5 | |
| 14.2 | 13.3 | 14.1 | 14.9 | 16.3 | 17.0 | 15.2 | 18.0 | 18.1 | 18.3 | |
| 12.1 | 14.1 | 27.4 | 36.5 | 37.8 | 33.1 | 47.7 | 49.3 | 53.9 | 62.5 | |
| 10.6 | 7.4 | 10.9 | 17.5 | 16.6 | 7.8 | 7.2 | 15.8 | 6.7 | ||
| 8.9 | 8.8 | 8.9 | 11.9 | 10.4 | 11.4 | 14.4 | 13.8 | 14.6 | 12.2 | |
| 8.5 | 8.4 | 8.1 | 8.5 | 8.4 | 9.7 | 9.1 | 7.9 | 9.1 | ||
| 8.4 | 8.7 | 8.7 | 4.4 | 4.0 | 3.3 | 3.4 | 3.0 | 3.0 | 3.6 | |
| 6.7 | 6.2 | 6.6 | 7.7 | 7.9 | 7.2 | 6.7 | 6.8 | 6.9 | 13.9 | |
| 6.7 | 5.6 | 5.4 | 6.4 | 7.0 | 8.1 | 8.0 | 7.9 | 8.6 | 5.9 | |
| 5.1 | 4.1 | 4.0 | 3.9 | 4.0 | 4.4 | 4.1 | ||||
| World | 8,067.2 | 7,688.1 | 8,064.9 | 8,075.2 | 7,727.3 | 7,460.4 | 7,861.1 | 8,164.9 | 8,074.6 | 6,395.6 |
References
- 1 2 3 "International - U.S. Energy Information Administration (EIA)". www.eia.gov. Retrieved 5 October 2023.
- ↑ "bp Statistical Review of World Energy July 2021".
- ↑ "Statistical Review of World Energy 2018".
- 1 2 "Statistical Review of World Energy 2017".
- ↑ Statistical Review of World Energy 2016
- ↑ Statistical Review of World Energy 2015 Archived 2015-06-20 at the Wayback Machine
- ↑ "Statistical Review of World Energy 2008". British Petroleum. Archived from the original on 2008-07-27.
- 1 2 3 4 5 6 EIA: International Energy Statistics
This article is issued from Wikipedia. The text is licensed under Creative Commons - Attribution - Sharealike. Additional terms may apply for the media files.