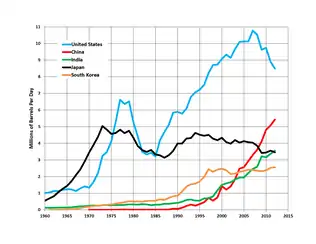
Trends in the top five crude oil-importing countries, 1960–2012
This is a list of countries by oil imports based on The World Factbook ^ and other sources.[1] Many countries also export oil, and some export more oil than they import.
| Country/Region | Crude Oil - Imports (bbl/day - est.) | Year of Information |
|---|---|---|
| 14,060,000 | 2017 | |
| 10,852,615 | 2020[3] | |
| 5,877,000 | 2020 | |
| 4,033,050 | 2020[4] | |
| 2,472,364 | 2020 | |
| 2,660,369 | 2020 | |
| 1,671,178 | 2020 | |
| 1,014,241 | 2020 | |
| 1,104,594 | 2020 | |
| 708,708 | 2020 | |
| 997,769 | 2020 | |
| 666,180 | 2020 | |
| 752,917 | 2020 | |
| 837,333 | 2020 | |
| 841,300 | 2015 | |
| 718,374 | 2020 | |
| 550,918 | 2020 | |
| 458,531 | 2020 | |
| 538,907 | 2019 | |
| 231,934 | 2020 | |
| 433,400 | 2012 | |
| 451,667 | 2019 | |
| 233,000 | 2020 | |
| 379,600 | 2013 | |
| 372,800 | 2013 | |
| 352,300 | 2013 | |
| 344,900 | 2012 | |
| 282,400 | 2013 | |
| 275,600 | 2013 | |
| 243,300 | 2012 | |
| 236,000 | 2013 | |
| 229,000 | 2012 | |
| 200,200 | 2012 | |
| 186,900 | 2013 | |
| 181,900 | 2012 | |
| 173,900 | 2014 | |
| 160,000 | 2013 | |
| 148,500 | 2012 | |
| 131,300 | 2013 | |
| 128,100 | 2012 | |
| 118,400 | 2012 | |
| 117,600 | 2013 | |
| 115,300 | 2013 | |
| 110,600 | 2012 | |
| 104,900 | 2012 | |
| 101,400 | 2013 | |
| 101,200 | 2013 | |
| 99,690 | 2013 | |
| 89,300 | 2020 | |
| 80,000 | 2013 | |
| 72,860 | 2012 | |
| 70,000 | 2013 | |
| 66,490 | 2013 | |
| 59,440 | 2013 | |
| 59,180 | 2012 | |
| 53,700 | 2012 | |
| 40,880 | 2012 | |
| 37,300 | 2014 | |
| 37,080 | 2013 | |
| 33,020 | 2012 | |
| 32,520 | 2012 | |
| 31,960 | 2012 | |
| 31,730 | 2014 | |
| 29,650 | 2014 | |
| 28,140 | 2012 | |
| 26,500 | 2012 | |
| 25,320 | 2012 | |
| 24,200 | 2012 | |
| 24,160 | 2012 | |
| 22,120 | 2012 | |
| 20,040 | 2012 | |
| 19,830 | 2012 | |
| 15,560 | 2012 | |
| 14,880 | 2012 | |
| 14,340 | 2012 | |
| 13,580 | 2014 | |
| 9,940 | 2012 | |
| 9,884 | 2013 | |
| 5,900 | 2012 | |
| 4,493 | 2012 | |
| 3,440 | 2012 | |
| 340 | 2012 | |
| 146 | 2014 | |
| 140 | 2012 | |
| 100 | 2012 | |
| 40 | 2012 |
See also
References
- ↑ "International - U.S. Energy Information Administration (EIA)".
- ↑ "The World Factbook". report. Central Intelligence Agency. Archived from the original on June 16, 2013. Retrieved 12 September 2016.
- ↑ "China becomes world's largest oil importer". www.ecns.cn. Retrieved 2018-02-07.
- ↑ "India's oil imports hit record high in January". The Economic Times. 2018-02-15. Retrieved 2018-02-16.
This article is issued from Wikipedia. The text is licensed under Creative Commons - Attribution - Sharealike. Additional terms may apply for the media files.