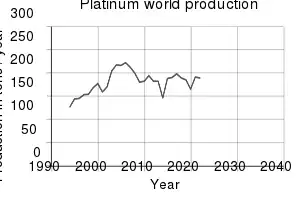
World production
This is a list of countries by platinum production. It is based on information from the United States Geological Survey.[1]
| Rank | Country/Region | Platinum production (kilograms) | Year |
|---|---|---|---|
| World | 180,000 | 2019 | |
| 1 | 130,000 | 2019 | |
| 2 | 22,000 | 2019 | |
| 3 | 15,000 | 2019 | |
| 4 | 7,400 | 2019 | |
| 5 | 3,600 | 2019 | |
| 6 | 2,500 | 2017 | |
| 7 | 1,747 | 2017 | |
| 8 | 1,418 | 2017 | |
| 9 | 566 | 2017 | |
| 10 | 170 | 2017 | |
| 11 | 97 | 2017 | |
| 12 | 5 | 2017 | |
| 13 | 2 | 2017 |
References
- ↑ "Platinum-Group Metals Statistics and Information" (PDF). www.usgs./myb1-2017-plati.pdf. USGS. 2018. Retrieved 2020-07-30.
This article is issued from Wikipedia. The text is licensed under Creative Commons - Attribution - Sharealike. Additional terms may apply for the media files.