| Opinion polling for UK general elections |
|---|
| February 1974 election |
| Opinion polls |
| October 1974 election |
| Opinion polls |
| 1979 election |
| Opinion polls |
| 1983 election |
| Opinion polls |
| 1987 election |
| Opinion polls |
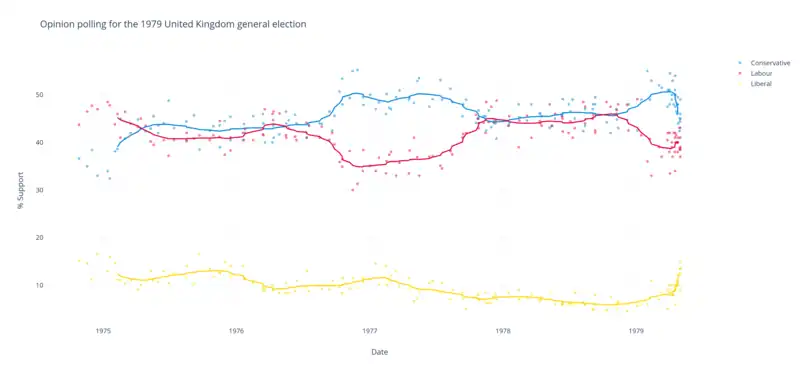
In the run-up to the 1979 general election, various organisations carried out opinion polling to gauge voting intention. Results of such polls are displayed in this article. The date range for these opinion polls are from the October general election until 3 May 1979.
Graphical summaries
The chart below depicts opinion polls conducted for the 1979 United Kingdom general election using a 15-poll moving average.
Conservatives
Labour
Liberals
National Poll Results
All data is from UK Polling Report.[1]
1979
| Survey end date |
Pollster | Client | Lab | Con | Lib | Lead |
|---|---|---|---|---|---|---|
| 3 May | 1979 general election | 36.9% | 43.9% | 13.8% | 7% | |
| 2 May | Gallup | The Daily Telegraph | 38.5% | 49% | 9% | 10.5% |
| 2 May | NOP | Daily Mail | 39% | 46% | 12.5% | 7% |
| 2 May | Gallup | The Daily Telegraph | 41% | 43% | 13.5% | 2% |
| 2 May | MORI | Evening Standard | 37% | 45% | 15% | 8% |
| 1 May | MORI | Daily Express | 38.8% | 44.4% | 13.5% | 5.6% |
| 1 May | Marplan | The Sun | 38.5% | 45% | 9% | 6.5% |
| 30 Apr | NOP | Daily Mail | 43.1% | 42.4% | 12.2% | 0.7% |
| 26 Apr | MORI | Daily Express | 41% | 44% | 12% | 3% |
| 25 Apr | Gallup | The Sunday Telegraph | 40% | 48% | 10.5% | 8% |
| 25 Apr | Research Srv | The Observer | 38% | 49.5% | 10% | 11.5% |
| 25 Apr | Marplan | The Sun | 40% | 48% | 10% | 8% |
| 23 Apr | MORI | Daily Express | 40% | 46% | 11% | 6% |
| 21 Apr | Gallup | The Daily Telegraph | 41.5% | 46.5% | 10% | 5% |
| 19 Apr | Marplan | The Sun | 40% | 50% | 9% | 10% |
| 18 Apr | Gallup | The Sunday Telegraph | 42% | 47.5% | 9% | 5.5% |
| 18 Apr | Marplan | The Sun | 41% | 51% | 6% | 10% |
| 18 Apr | Research Srv | The Observer | 34% | 54% | 9.5% | 20% |
| 17 Apr | MORI | Daily Express | 38% | 50% | 10% | 12% |
| 14 Apr | NOP | Daily Mail | 42% | 48% | 8% | 6% |
| 11 Apr | Research Srv | The Observer | 37% | 53% | 8% | 16% |
| 9 Apr | Gallup | The Daily Telegraph | 40% | 50% | 8% | 10% |
| 9 Apr | MORI | Daily Express | 39% | 49% | 10% | 10% |
| 7 Apr | The Dissolution of the 47th Parliament and campaigning officially begins | |||||
| 4 Apr | Research Srv | The Observer | 33.5% | 54.5% | 9% | 21% |
| 3 Apr | NOP | Daily Mail | 42% | 48% | 8% | 6% |
| 2 Apr | MORI | Daily Express | 38% | 51% | 10% | 13% |
| 29 Mar | MORI | Thames | 42% | 51% | 5% | 9% |
| 29 Mar | Liverpool Edge Hill by-election | |||||
| 28 Mar | The vote of no confidence in the Callaghan ministry passes[2] | |||||
| 28 Mar | Gallup | The Daily Telegraph | 40.5% | 47.5% | 9% | 7% |
| 12 Mar | Gallup | The Daily Telegraph | 37% | 51.5% | 8.5% | 14.5% |
| 5 Mar | MORI | N/A | 39% | 52% | 7% | 13% |
| 1 Mar | Knutsford and Clitheroe by-elections | |||||
| 14 Feb | The Winter of Discontent ends following negotiations with the TUC[3] | |||||
| 12 Feb | Gallup | The Daily Telegraph | 33% | 53% | 11% | 20% |
| 8 Feb | NOP | N/A | 40.7% | 49% | 7.4% | 8.3% |
| 1 Feb | MORI | N/A | 36% | 55% | 6% | 19% |
| 15 Jan | Gallup | The Daily Telegraph | 41.5% | 49% | 6% | 7.5% |
| 4 Jan | NOP | N/A | 49.1% | 42.5% | 5.7% | 6.6% |
1978
| Survey end date |
Pollster | Client | Lab | Con | Lib | Lead |
|---|---|---|---|---|---|---|
| 14 Dec | The Callaghan ministry survives a vote of no confidence[4] | |||||
| 11 Dec | Gallup | The Daily Telegraph | 42.5% | 48% | 6% | 5.5% |
| 7 Dec | NOP | N/A | 47.9% | 44.7% | 4.6% | 3.2% |
| 13 Nov | Gallup | The Daily Telegraph | 48% | 43% | 6.5% | 5% |
| 9 Nov | NOP | N/A | 46.8% | 44.8% | 6.2% | 2% |
| 8 Nov | MORI | N/A | 46% | 47% | 5% | 1% |
| 26 Oct | Pontefract and Castleford & Berwick and East Lothian by-elections | |||||
| 23 Oct | Gallup | The Daily Telegraph | 47.5% | 42% | 7.5% | 5.5% |
| 12 Oct | NOP | N/A | 48.5% | 44.2% | 4.7% | 4.3% |
| 11 Sep | Gallup | The Daily Telegraph | 42.5% | 49.5% | 6% | 7% |
| 11 Sep | MORI | N/A | 42% | 48% | 8% | 6% |
| 7 Sep | The Lib-Lab pact ends[5] | |||||
| 5 Sep | NOP | N/A | 45.8% | 48% | 4.8% | 2.2% |
| 4 Sep | MORI | N/A | 45% | 47% | 5% | 2% |
| 14 Aug | Gallup | The Daily Telegraph | 47.5% | 43.5% | 6% | 4% |
| 14 Aug | MORI | N/A | 44% | 47% | 6% | 3% |
| 9 Aug | NOP | N/A | 48.5% | 42.4% | 6.3% | 6.1% |
| 17 Jul | Gallup | The Daily Telegraph | 43% | 45% | 8.5% | 2% |
| 13 Jul | Penistone & Manchester Moss Side by-elections | |||||
| 11 Jul | MORI | N/A | 41% | 49% | 6% | 8% |
| 5 Jul | NOP | N/A | 44.4% | 46.5% | 6.3% | 2.1% |
| 30 Jun | MORI | N/A | 42% | 48% | 6% | 6% |
| 14 Jun | NOP | N/A | 42.3% | 49.1% | 6.3% | 6.8% |
| 13 Jun | MORI | N/A | 45% | 46% | 6% | 1% |
| 12 Jun | Gallup | The Daily Telegraph | 45.5% | 45.5% | 6% | Tie |
| 31 May | Hamilton by-election | |||||
| 24 May | MORI | N/A | 46% | 45% | 6% | 1% |
| 15 May | Gallup | The Daily Telegraph | 43.5% | 43.5% | 8.5% | Tie |
| 9 May | NOP | N/A | 48% | 43.1% | 7% | 4.9% |
| 2–4 May | 1978 local elections[6] | |||||
| 27 Apr | Wycombe & Epsom and Ewell by-elections | |||||
| 20 Apr | Lambeth Central by-election | |||||
| 17 Apr | Gallup | The Daily Telegraph | 43.5% | 45.5% | 7.5% | 2% |
| 13 Apr | MORI | N/A | 44% | 46% | 7% | 2% |
| 13 Apr | Glasgow Garscadden by-election | |||||
| 12 Apr | NOP | N/A | 44.5% | 46.2% | 6.6% | 1.7% |
| 20 Mar | Gallup | The Daily Telegraph | 41% | 48% | 8% | 7% |
| 8 Mar | NOP | N/A | 45.6% | 44.6% | 7.3% | 1% |
| 2 Mar | Ilford North by election | |||||
| 15 Feb | NOP | N/A | 44.6% | 45.3% | 7.1% | 0.7% |
| 13 Feb | Gallup | The Daily Telegraph | 39% | 48% | 9% | 9% |
| 18 Jan | NOP | 45.5% | 44% | 7.5% | 1.5% | |
| 16 Jan | Gallup | The Daily Telegraph | 43.5% | 43.5% | 8.5% | Tie |
1977
| Survey end date |
Pollster | Client | Lab | Con | Lib | Lead |
|---|---|---|---|---|---|---|
| 14 Dec | NOP | N/A | 48.8% | 40.8% | 7% | 8% |
| 12 Dec | Gallup | The Daily Telegraph | 44.5% | 44% | 8% | 0.5% |
| 7 Dec | NOP | N/A | 44.1% | 44.6% | 7.5% | 0.5% |
| 30 Nov | NOP | N/A | 47.5% | 43.2% | 6.3% | 4.3% |
| 24 Nov | Bournemouth East by election | |||||
| 23 Nov | NOP | N/A | 44.3% | 46.7% | 6.2% | 2.4% |
| 16 Nov | NOP | N/A | 48.5% | 42.5% | 6.2% | 6% |
| 14 Nov | Gallup | The Daily Telegraph | 42% | 45.5% | 8.5% | 3.5% |
| 9 Nov | NOP | N/A | 44.1% | 45.5% | 7% | 1.4% |
| 26 Oct | NOP | N/A | 43% | 46.7% | 6.9% | 3.7% |
| 26 Oct | MORI | N/A | 44% | 45% | 7% | 1% |
| 24 Oct | Gallup | The Daily Telegraph | 45% | 45% | 8% | Tie |
| 19 Oct | NOP | N/A | 45.8% | 44.1% | 7.3% | 1.7% |
| 22 Sep | MORI | N/A | 42% | 49% | 5% | 7% |
| 14 Sep | NOP | N/A | 41.8% | 48% | 7.3% | 6.2% |
| 12 Sep | Gallup | The Daily Telegraph | 41% | 45.5% | 8.5% | 4.5% |
| 18 Aug | Birmingham Ladywood by election | |||||
| 15 Aug | Gallup | The Daily Telegraph | 37.5% | 48.5% | 9% | 11% |
| 10 Aug | NOP | N/A | 38.2% | 51.3% | 7.1% | 13.1% |
| 18 Jul | Gallup | The Daily Telegraph | 34.5% | 49% | 10.5% | 14.5% |
| 13 Jul | NOP | N/A | 35.1% | 53.1% | 8.4% | 18% |
| 7 Jul | Saffron Walden by election | |||||
| 22 Jun | NOP | N/A | 37.1% | 49.1% | 10.8% | 12% |
| 13 Jun | Gallup | The Daily Telegraph | 37% | 47.5% | 10.5% | 10.5% |
| 16 May | Gallup | The Daily Telegraph | 33% | 53.5% | 8.5% | 20.5% |
| 11 May | NOP | N/A | 36.9% | 52.9% | 7.2% | 16% |
| 3–18 May | 1977 local elections[7][8][9] | |||||
| 2 May | NOP | N/A | 41% | 48.3% | 6.6% | 7.3% |
| 28 Apr | Grimsby & Ashfield by-elections | |||||
| 20 Apr | NOP | N/A | 38.3% | 49.4% | 9.1% | 11.1% |
| 18 Apr | Gallup | The Daily Telegraph | 33.5% | 49% | 11.5% | 15.5% |
| 31 Mar | Birmingham Stechford by-election | |||||
| 23 Mar | NOP | N/A | 35.7% | 50.9% | 9.7% | 15.2% |
| 23 Mar | The Lib–Lab pact is formed[10][11] | |||||
| 14 Mar | Gallup | The Daily Telegraph | 33% | 49.5% | 13% | 16.5% |
| 28 Feb | MORI | N/A | 38% | 47% | 12% | 9% |
| 24 Feb | City of London and Westminster South by-election | |||||
| 23 Feb | NOP | N/A | 37.4% | 47.3% | 10.9% | 9.9% |
| 16 Feb | NOP | N/A | 36.1% | 50.2% | 10% | 14.1% |
| 14 Feb | Gallup | The Daily Telegraph | 33.5% | 46% | 14% | 12.5% |
| 26 Jan | NOP | N/A | 36.8% | 48.4% | 10.2% | 11.6% |
| 17 Jan | Gallup | The Daily Telegraph | 34% | 47% | 14.5% | 13% |
| 2 Jan | NOP | N/A | 35.1% | 50% | 11.2% | 14.9% |
1976
| Survey end date |
Pollster | Client | Lab | Con | Lib | Lead |
|---|---|---|---|---|---|---|
| 14 Dec | NOP | N/A | 38.4% | 47.9% | 10.6% | 9.5% |
| 2 Dec | Cambridge by-election | |||||
| 13 Dec | Gallup | The Daily Telegraph | 34% | 49.5% | 11.5% | 15.5% |
| 28 Nov | NOP | N/A | 31.3% | 55.2% | 9.4% | 23.9% |
| 15 Nov | Gallup | The Daily Telegraph | 30% | 55% | 11.5% | 25% |
| 7 Nov | NOP | N/A | 38.2% | 49.3% | 9.3% | 11.1% |
| 4 Nov | Workington, Walsall North and Newcastle-upon-Tyne Central by-elections | |||||
| 18 Oct | Gallup | The Daily Telegraph | 36.5% | 48% | 11.5% | 11.5% |
| 17 Oct | NOP | N/A | 34.9% | 53.4% | 8.3% | 18.5% |
| 10 Oct | NOP | N/A | 35.9% | 50.7% | 9.5% | 14.8% |
| 26 Sep | NOP | N/A | 39.6% | 45.6% | 9.9% | 6% |
| 20 Sep | Gallup | The Daily Telegraph | 42% | 42.5% | 11% | 0.5% |
| 12 Sep | NOP | N/A | 40.5% | 46.5% | 9.1% | 6% |
| 22 Aug | NOP | N/A | 43.3% | 43.9% | 9.3% | 0.6% |
| 16 Aug | Gallup | The Daily Telegraph | 41% | 44% | 10% | 3% |
| 18 Jul | NOP | N/A | 43.5% | 43.6% | 8.7% | 0.1% |
| 15 Jul | Thurrock by-election | |||||
| 12 Jul | Gallup | The Daily Telegraph | 41% | 41% | 13% | Tie |
| 11 Jul | NOP | N/A | 44.1% | 42.1% | 9.5% | 2% |
| 7 Jul | David Steel is elected leader of the Liberal Party[12] | |||||
| 24 Jun | Rotherham by-election | |||||
| 14 Jun | Gallup | The Daily Telegraph | 40.5% | 44% | 11% | 3.5% |
| 10 Jun | NOP | N/A | 41.2% | 45.8% | 8.8% | 4.6% |
| 23 May | NOP | N/A | 43% | 44.7% | 8.3% | 1.7% |
| 17 May | Gallup | The Daily Telegraph | 41% | 44% | 10.5% | 3% |
| 16 May | NOP | N/A | 41.5% | 46.5% | 8.3% | 5% |
| 6 May | 1976 local elections[13] | |||||
| 28 Apr | NOP | N/A | 46.1% | 41.7% | 8.4% | 4.4% |
| 12 Apr | Gallup | The Daily Telegraph | 46.5% | 41% | 9% | 5.5% |
| 11 Apr | NOP | N/A | 44.7% | 43.6% | 9% | 1.1% |
| 9 Apr | MORI | N/A | 46% | 40% | 10% | 6% |
| 5 Apr | James Callaghan is elected leader of the Labour Party and becomes Prime Minister[14] | |||||
| 19 Mar | MORI | N/A | 47% | 40% | 9% | 7% |
| 15 Mar | Gallup | The Daily Telegraph | 41.5% | 44% | 9.5% | 2.5% |
| 14 Mar | NOP | N/A | 41.7% | 46% | 8.8% | 4.3% |
| 11 Mar | Wirral & Carshalton by-elections | |||||
| 4 Mar | Coventry North West by-election | |||||
| 16 Feb | Gallup | The Daily Telegraph | 40.5% | 45.5% | 10.5% | 5% |
| 25 Jan | NOP | N/A | 42.8% | 42% | 11.3% | 0.8% |
| 22 Jan | NOP | N/A | 40.5% | 43.9% | 11.4% | 3.4% |
| 19 Jan | Gallup | The Daily Telegraph | 42% | 40.5% | 14% | 1.5% |
1975
| Survey end date |
Pollster | Client | Lab | Con | Lib | Lead |
|---|---|---|---|---|---|---|
| 16 Dec | NOP | N/A | 38.3% | 45.4% | 11.7% | 7.1% |
| 16 Dec | Gallup | The Daily Telegraph | 41% | 40.5% | 14% | 0.5% |
| 30 Nov | NOP | N/A | 37.4% | 44.5% | 14.9% | 7.1% |
| 17 Nov | Gallup | The Daily Telegraph | 44.5% | 39% | 12.5% | 5.5% |
| 16 Nov | NOP | N/A | 41.2% | 43.6% | 12.7% | 2.4% |
| 30 Oct | NOP | N/A | 41.5% | 43.4% | 11.8% | 1.9% |
| 20 Oct | Gallup | The Daily Telegraph | 40.5% | 42.5% | 13.5% | 2% |
| 22 Sep | Gallup | The Daily Telegraph | 41.5% | 38.5% | 16.5% | 3% |
| 7 Sep | NOP | N/A | 40.8% | 45.7% | 10.3% | 4.9% |
| 18 Aug | Gallup | The Daily Telegraph | 42% | 40.5% | 14% | 1.5% |
| 17 Aug | NOP | N/A | 40.3% | 44.4% | 11.6% | 4.1% |
| 14 Jul | Gallup | The Daily Telegraph | 40.5% | 43% | 12.5% | 2.5% |
| 29 Jun | NOP | N/A | 37.2% | 48.8% | 10.4% | 11.6% |
| 26 Jun | Woolwich West by-election | |||||
| 16 Jun | Gallup | The Daily Telegraph | 40.5% | 44% | 13% | 3.5% |
| 5 Jun | The United Kingdom votes "Yes" to staying in the European Community[15] | |||||
| 1 Jun | NOP | N/A | 43.6% | 42% | 10.7% | 1.6% |
| 19 May | Gallup | The Daily Telegraph | 39.5% | 45.5% | 11% | 6% |
| 11 May | NOP | N/A | 40.2% | 42.9% | 13% | 2.7% |
| 1 May | 1975 local elections[16] | |||||
| 27 Apr | NOP | N/A | 43.5% | 42.4% | 10.9% | 1.1% |
| 14 Apr | Gallup | The Daily Telegraph | 45% | 43% | 10% | 2% |
| 6 Apr | NOP | N/A | 43.3% | 44.8% | 9.1% | 1.5% |
| 17 Mar | Gallup | The Daily Telegraph | 44% | 42% | 11% | 2% |
| 2 Mar | NOP | N/A | 46.4% | 40.8% | 10.3% | 5.6% |
| 17 Feb | Gallup | The Daily Telegraph | 41% | 45% | 11% | 4% |
| 11 Feb | Margaret Thatcher is elected leader of the Conservative Party[17][18] | |||||
| 9 Feb | NOP | N/A | 46% | 38.6% | 11.1% | 7.4% |
| 2 Feb | NOP | N/A | 43.8% | 38.1% | 14.6% | 5.7% |
| 19 Jan | NOP | N/A | 47.8% | 32.4% | 15.9% | 15.4% |
| 13 Jan | Gallup | The Daily Telegraph | 48.5% | 34% | 13% | 14.5% |
1974
| Survey end date |
Pollster | Client | Lab | Con | Lib | Lead |
|---|---|---|---|---|---|---|
| 16 Dec | Gallup | The Daily Telegraph | 47% | 33% | 16.5% | 14% |
| 1 Dec | NOP | N/A | 47.7% | 38.4% | 11.1% | 9.3% |
| 18 Nov | Gallup | The Daily Telegraph | 46.5% | 35% | 14.5% | 11.5% |
| 27 Oct | NOP | N/A | 43.7% | 36.6% | 15.1% | 7.1% |
| 10 Oct | Oct 1974 general election | 39.2% | 35.8% | 18.3% | 3.4% | |
References
- ↑ "UK Polling Report". ukpollingreport.co.uk. Retrieved 16 December 2019.
- ↑ Aikten, Ian (29 March 1979). "Labour fall by one vote". The Guardian.
- ↑ Jenkins, Peter (15 February 1979). "Pay later deal in Callaghan's survival kit". The Guardian.
- ↑ Aikten, Ian; Harper, Keith (15 December 1978). "Callaghan home by 10 Votes". The Guardian.
- ↑ Aikten, Ian (8 September 1978). "Callaghan gambles on finding new Allies". The Guardian.
- ↑ Jordan, Philip (5 May 1978). "Labour slips in London after gains in North". The Guardian.
- ↑ Hetherington, Peter (4 May 1977). "Big gains for SNP but Glasgow is split". The Guardian.
- ↑ Jordan, Philip (6 May 1977). "Massive swing gives Tories the cities". The Guardian.
- ↑ McHardy, Anne; Wainwright, Martin (19 May 1977). "Shots fired in Ulster poll". The Guardian.
- ↑ "Joint Statement on the Lib-Lab Pact: Steel and Callaghan – Liberal History". Liberal History. 24 March 1977. Retrieved 16 July 2021.
- ↑ Aikten, Ian (24 March 1977). "Liberal deal strains Left". The Guardian.
- ↑ Hoggart, Simon (8 July 1976). "Smith snub victor Steel". The Guardian.
- ↑ Lewis, James (7 May 1976). "Tories gain – but no landslide". The Guardian.
- ↑ Aikten, Ian (6 April 1976). "Callaghan puts his trust in the people". The Guardian.
- ↑ McKie, David (7 June 1975). "Anatomy of a Landslide". The Guardian.
- ↑ Johnson, Dennis (2 May 1975). "Tories weaken Labour grip". The Guardian.
- ↑ Aikten, Ian (12 February 1975). "First lady will put Tories right". The Guardian.
- ↑ Parry, Gareth (12 February 2015). "From the archive, 12 February 1975: Dreamy, says Thatcher, the new chief Tory". The Guardian. Retrieved 16 July 2021.
This article is issued from Wikipedia. The text is licensed under Creative Commons - Attribution - Sharealike. Additional terms may apply for the media files.