| ||||||||||||||||||||||||||
| ||||||||||||||||||||||||||


| ||||||||||||||||||||||||||
| ||||||||||||||||||||||||||
.jpg.webp)
_(3x4-1).jpg.webp)
| Elections in North Carolina |
|---|
 |
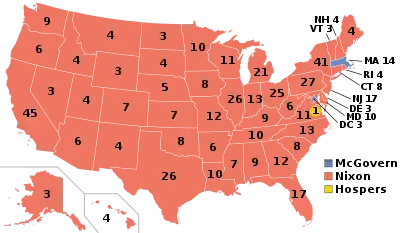
The 1972 United States presidential election in North Carolina took place on November 7, 1972, as part of the 1972 United States presidential election. Voters chose 13 representatives, or electors to the Electoral College, who voted for president and vice president.
Amidst a nationwide landslide defeat especially felt in the South, McGovern won only two counties in North Carolina, neither of which have voted for a Republican presidential candidate since the Fourth Party System era: Orange County in the Research Triangle region, home of the University of North Carolina at Chapel Hill, and majority-Black Northampton County in the northeast of the state.[1] Even in these counties, where most Democratic candidates receive over sixty percent of the vote (and where Walter Mondale in 1984 would still win by double digits), McGovern won by less than five points.[2] 78% of white voters supported Nixon, while only 20% supported McGovern.[3][4]
1972 was the first election in which a presidential candidate received more than one million votes in the Tar Heel State, and remains the best Republican presidential performance in its history. This is also the last election to date in which Bertie County, Durham County, Edgecombe County, Halifax County, Hertford County, Hoke County, Warren County, or Washington County voted for the Republican candidate.[5]
Polls
| Source | Rating | As of |
|---|---|---|
| Corvallis Gazette-Times[6] | Safe R | September 19, 1972 |
| The Bradenton Herald[7] | Certain R | October 9, 1972 |
| The Austin American[8] | Certain R | November 1, 1972 |
| Sun Herald[9] | Certain R | November 5, 1972 |
Results
| 1972 United States presidential election in North Carolina[10] | |||||
|---|---|---|---|---|---|
| Party | Candidate | Votes | Percentage | Electoral votes | |
| Republican | Richard Nixon (incumbent) | 1,054,889 | 69.46% | 13 | |
| Democratic | George McGovern | 438,705 | 28.89% | 0 | |
| American Independent | John G. Schmitz | 25,018 | 1.65% | 0 | |
| Write-ins[lower-alpha 1] | Various candidates | 162 | 0.01% | 0 | |
| Totals | 1,518,774 | 100.0% | 13 | ||
| Voter turnout | 44.35% | — | |||
Results by county
| County | Richard Milhous Nixon Republican |
George Stanley McGovern Democratic |
John George Schmitz American |
Margin | ||||
|---|---|---|---|---|---|---|---|---|
| % | # | % | # | % | # | % | # | |
| Avery | 83.99% | 3,510 | 15.00% | 627 | 1.01% | 42 | 68.99% | 2,883 |
| Mitchell | 83.45% | 4,240 | 15.74% | 800 | 0.81% | 41 | 67.70% | 3,440 |
| Henderson | 80.17% | 12,134 | 17.85% | 2,701 | 1.98% | 300 | 62.33% | 9,433 |
| Onslow | 80.05% | 10,343 | 18.76% | 2,424 | 1.19% | 154 | 61.29% | 7,919 |
| Yadkin | 79.16% | 6,824 | 18.47% | 1,592 | 2.38% | 205 | 60.69% | 5,232 |
| Johnston | 79.24% | 14,272 | 19.37% | 3,488 | 1.39% | 251 | 59.87% | 10,784 |
| Craven | 78.74% | 9,372 | 20.03% | 2,384 | 1.23% | 147 | 58.71% | 6,988 |
| Davie | 75.69% | 5,613 | 21.28% | 1,578 | 3.03% | 225 | 54.41% | 4,035 |
| Randolph | 76.02% | 18,724 | 21.71% | 5,346 | 2.27% | 559 | 54.32% | 13,378 |
| Cabarrus | 76.45% | 18,384 | 22.19% | 5,336 | 1.36% | 328 | 54.26% | 13,048 |
| Gaston | 75.76% | 27,956 | 22.93% | 8,462 | 1.31% | 483 | 52.83% | 19,494 |
| Greene | 75.68% | 2,788 | 22.99% | 847 | 1.33% | 49 | 52.69% | 1,941 |
| Davidson | 74.79% | 24,875 | 23.12% | 7,691 | 2.09% | 696 | 51.66% | 17,184 |
| Alamance | 74.61% | 22,046 | 23.12% | 6,833 | 2.27% | 670 | 51.48% | 15,213 |
| New Hanover | 74.41% | 19,060 | 23.01% | 5,894 | 2.58% | 661 | 51.40% | 13,166 |
| Iredell | 73.79% | 16,736 | 22.43% | 5,088 | 3.78% | 858 | 51.35% | 11,648 |
| Dare | 75.20% | 1,986 | 24.01% | 634 | 0.80% | 21 | 51.19% | 1,352 |
| Catawba | 74.46% | 24,106 | 23.92% | 7,744 | 1.62% | 525 | 50.54% | 16,362 |
| Harnett | 74.64% | 10,259 | 24.35% | 3,347 | 1.00% | 138 | 50.29% | 6,912 |
| Carteret | 74.14% | 8,463 | 24.57% | 2,805 | 1.29% | 147 | 49.57% | 5,658 |
| Lenoir | 73.89% | 11,065 | 24.52% | 3,672 | 1.59% | 238 | 49.37% | 7,393 |
| Rowan | 73.34% | 20,735 | 24.17% | 6,834 | 2.49% | 705 | 49.17% | 13,901 |
| Wilson | 73.04% | 12,060 | 25.23% | 4,166 | 1.73% | 286 | 47.81% | 7,894 |
| Lee | 72.71% | 5,836 | 25.22% | 2,024 | 2.07% | 166 | 47.50% | 3,812 |
| Wilkes | 72.83% | 13,105 | 25.75% | 4,634 | 1.42% | 255 | 47.08% | 8,471 |
| McDowell | 72.09% | 6,570 | 25.76% | 2,348 | 2.15% | 196 | 46.32% | 4,222 |
| Nash | 71.39% | 12,679 | 25.35% | 4,503 | 3.26% | 579 | 46.03% | 8,176 |
| Wayne | 72.33% | 14,352 | 26.38% | 5,234 | 1.29% | 256 | 45.95% | 9,118 |
| Cleveland | 72.06% | 13,726 | 26.22% | 4,994 | 1.72% | 328 | 45.84% | 8,732 |
| Person | 71.89% | 5,941 | 27.18% | 2,246 | 0.93% | 77 | 44.71% | 3,695 |
| Caldwell | 71.41% | 12,976 | 26.89% | 4,886 | 1.70% | 309 | 44.52% | 8,090 |
| Union | 71.60% | 10,264 | 27.11% | 3,886 | 1.30% | 186 | 44.49% | 6,378 |
| Hyde | 69.28% | 1,112 | 25.11% | 403 | 5.61% | 90 | 44.17% | 709 |
| Rockingham | 71.15% | 14,519 | 27.10% | 5,530 | 1.75% | 358 | 44.05% | 8,989 |
| Moore | 70.68% | 9,406 | 27.25% | 3,627 | 2.07% | 275 | 43.43% | 5,779 |
| Columbus | 70.64% | 8,468 | 27.57% | 3,305 | 1.79% | 214 | 43.07% | 5,163 |
| Buncombe | 70.38% | 32,091 | 27.69% | 12,626 | 1.92% | 877 | 42.69% | 19,465 |
| Duplin | 70.61% | 7,153 | 28.20% | 2,857 | 1.18% | 120 | 42.41% | 4,296 |
| Transylvania | 69.73% | 5,860 | 27.62% | 2,321 | 2.65% | 223 | 42.11% | 3,539 |
| Wake | 70.32% | 56,808 | 28.23% | 22,807 | 1.45% | 1,174 | 42.09% | 34,001 |
| Cumberland | 70.46% | 24,376 | 28.48% | 9,853 | 1.06% | 366 | 41.98% | 14,523 |
| Pitt | 70.41% | 14,406 | 28.63% | 5,858 | 0.95% | 195 | 41.78% | 8,548 |
| Brunswick | 69.06% | 6,153 | 28.06% | 2,500 | 2.87% | 256 | 41.00% | 3,653 |
| Beaufort | 69.65% | 6,915 | 29.22% | 2,901 | 1.13% | 112 | 40.43% | 4,014 |
| Stanly | 69.32% | 12,459 | 29.03% | 5,218 | 1.64% | 295 | 40.29% | 7,241 |
| Guilford | 69.46% | 61,381 | 29.20% | 25,800 | 1.34% | 1,185 | 40.27% | 35,581 |
| Alexander | 68.95% | 5,865 | 29.01% | 2,468 | 2.03% | 173 | 39.94% | 3,397 |
| Macon | 69.20% | 4,134 | 29.28% | 1,749 | 1.52% | 91 | 39.92% | 2,385 |
| Pender | 68.90% | 3,327 | 29.30% | 1,415 | 1.80% | 87 | 39.59% | 1,912 |
| Burke | 68.96% | 14,447 | 29.58% | 6,197 | 1.46% | 306 | 39.38% | 8,250 |
| Franklin | 68.37% | 5,431 | 29.47% | 2,341 | 2.17% | 172 | 38.90% | 3,090 |
| Rutherford | 68.80% | 9,506 | 29.97% | 4,140 | 1.23% | 170 | 38.84% | 5,366 |
| Mecklenburg | 68.52% | 77,546 | 29.80% | 33,730 | 1.68% | 1,900 | 38.71% | 43,816 |
| Martin | 68.76% | 4,188 | 30.21% | 1,840 | 1.03% | 63 | 38.55% | 2,348 |
| Surry | 67.78% | 10,497 | 30.39% | 4,706 | 1.83% | 284 | 37.39% | 5,791 |
| Forsyth | 67.69% | 46,415 | 30.52% | 20,928 | 1.79% | 1,226 | 37.17% | 25,487 |
| Polk | 67.31% | 3,121 | 30.54% | 1,416 | 2.16% | 100 | 36.77% | 1,705 |
| Currituck | 66.67% | 1,578 | 30.33% | 718 | 3.00% | 71 | 36.33% | 860 |
| Stokes | 66.86% | 7,118 | 30.57% | 3,254 | 2.57% | 274 | 36.30% | 3,864 |
| Halifax | 66.60% | 8,908 | 31.71% | 4,241 | 1.69% | 226 | 34.89% | 4,667 |
| Vance | 66.85% | 6,491 | 32.10% | 3,117 | 1.05% | 102 | 34.75% | 3,374 |
| Granville | 66.82% | 6,037 | 32.30% | 2,918 | 0.89% | 80 | 34.52% | 3,119 |
| Chowan | 66.39% | 1,906 | 32.60% | 936 | 1.01% | 29 | 33.79% | 970 |
| Montgomery | 65.67% | 4,417 | 32.34% | 2,175 | 1.99% | 134 | 33.33% | 2,242 |
| Pamlico | 66.11% | 1,847 | 32.89% | 919 | 1.00% | 28 | 33.21% | 928 |
| Sampson | 65.76% | 9,684 | 33.19% | 4,888 | 1.05% | 154 | 32.57% | 4,796 |
| Haywood | 64.84% | 8,903 | 32.88% | 4,515 | 2.28% | 313 | 31.96% | 4,388 |
| Clay | 65.19% | 1,545 | 33.63% | 797 | 1.18% | 28 | 31.56% | 748 |
| Bladen | 64.72% | 4,205 | 33.88% | 2,201 | 1.40% | 91 | 30.85% | 2,004 |
| Swain | 64.45% | 2,052 | 34.58% | 1,101 | 0.97% | 31 | 29.87% | 951 |
| Pasquotank | 63.07% | 3,906 | 34.15% | 2,115 | 2.78% | 172 | 28.92% | 1,791 |
| Scotland | 63.69% | 3,485 | 35.42% | 1,938 | 0.90% | 49 | 28.27% | 1,547 |
| Perquimans | 62.57% | 1,299 | 34.83% | 723 | 2.60% | 54 | 27.75% | 576 |
| Edgecombe | 62.53% | 8,244 | 35.16% | 4,635 | 2.31% | 305 | 27.37% | 3,609 |
| Ashe | 62.95% | 5,784 | 36.06% | 3,313 | 0.99% | 91 | 26.89% | 2,471 |
| Watauga | 62.85% | 6,017 | 36.05% | 3,451 | 1.10% | 105 | 26.80% | 2,566 |
| Cherokee | 62.28% | 4,113 | 36.51% | 2,411 | 1.21% | 80 | 25.77% | 1,702 |
| Chatham | 62.12% | 6,175 | 36.46% | 3,624 | 1.43% | 142 | 25.66% | 2,551 |
| Lincoln | 61.88% | 8,597 | 36.71% | 5,100 | 1.40% | 195 | 25.17% | 3,497 |
| Washington | 61.65% | 2,559 | 37.24% | 1,546 | 1.11% | 46 | 24.40% | 1,013 |
| Alleghany | 61.29% | 2,158 | 37.03% | 1,304 | 1.68% | 59 | 24.25% | 854 |
| Durham | 61.38% | 25,576 | 37.36% | 15,566 | 1.26% | 525 | 24.02% | 10,010 |
| Camden | 60.20% | 909 | 36.82% | 556 | 2.98% | 45 | 23.38% | 353 |
| Anson | 60.88% | 3,551 | 37.51% | 2,188 | 1.61% | 94 | 23.37% | 1,363 |
| Richmond | 60.84% | 5,692 | 37.49% | 3,508 | 1.67% | 156 | 23.34% | 2,184 |
| Graham | 61.05% | 1,699 | 37.98% | 1,057 | 0.97% | 27 | 23.07% | 642 |
| Madison | 61.18% | 3,273 | 38.11% | 2,039 | 0.71% | 38 | 23.07% | 1,234 |
| Bertie | 60.54% | 2,874 | 38.32% | 1,819 | 1.14% | 54 | 22.22% | 1,055 |
| Caswell | 59.65% | 2,983 | 38.43% | 1,922 | 1.92% | 96 | 21.22% | 1,061 |
| Robeson | 59.99% | 11,362 | 39.02% | 7,391 | 0.99% | 188 | 20.97% | 3,971 |
| Warren | 59.62% | 2,603 | 38.89% | 1,698 | 1.49% | 65 | 20.73% | 905 |
| Jones | 58.93% | 1,650 | 39.04% | 1,093 | 2.04% | 57 | 19.89% | 557 |
| Jackson | 59.11% | 4,709 | 39.78% | 3,169 | 1.12% | 89 | 19.33% | 1,540 |
| Tyrrell | 59.30% | 676 | 40.26% | 459 | 0.44% | 5 | 19.04% | 217 |
| Hertford | 58.34% | 2,794 | 40.26% | 1,928 | 1.40% | 67 | 18.08% | 866 |
| Yancey | 57.10% | 3,106 | 41.88% | 2,278 | 1.03% | 56 | 15.22% | 828 |
| Hoke | 56.25% | 1,927 | 42.79% | 1,466 | 0.96% | 33 | 13.46% | 461 |
| Gates | 51.01% | 1,264 | 47.50% | 1,177 | 1.49% | 37 | 3.51% | 87 |
| Northampton | 47.71% | 2,997 | 51.46% | 3,233 | 0.83% | 52 | -3.76% | -236 |
| Orange | 47.66% | 11,632 | 51.76% | 12,634 | 0.58% | 142 | -4.11% | -1,002 |
Notes
References
- ↑ Sullivan, Robert David; ‘How the Red and Blue Map Evolved Over the Past Century’; America Magazine in The National Catholic Review; June 29, 2016
- ↑ David Leip’s Atlas of U.S. Presidential Elections; 1984 Presidential General Election Data Graphs – North Carolina
- ↑ Black & Black 1992, p. 295.
- ↑ Black & Black 1992, p. 335.
- ↑ "Presidential General Election Results Comparison – North Carolina". David Leip’s Atlas of U.S. Presidential Elections.
- ↑ "Nixon May Sweep Dixie States". Corvallis Gazette-Times. Corvallis, Oregon. September 19, 1972. p. 24.
- ↑ Phillips, Kevin P. (October 9, 1972). "Dixie May Swing Political Future". The Bradenton Herald. Bradenton, Florida. p. 7-B.
- ↑ Furgursson, Ernest B. (October 25, 1972). "By Democrats in South — National Issues Ignored". The Austin American. Austin, Texas. p. 4.
- ↑ "Nixon Expected To Sweep South". Sun Herald. Biloxi, Mississippi. November 5, 1972. p. C-9.
- ↑ "1972 Presidential General Election Data Graphs – North Carolina". David Leip’s Atlas of U.S. Presidential Elections.
- 1 2 Our Campaigns; NC US President Race, November 07, 1972
Works cited
- Black, Earl; Black, Merle (1992). The Vital South: How Presidents Are Elected. Harvard University Press. ISBN 0674941306.