| |||||||||||||||||||||||||||||||||||||
All 76[lower-alpha 1] seats in the House of Representatives 38 seats were needed for a majority in the House 22 (of the 36) seats in the Senate | |||||||||||||||||||||||||||||||||||||
|---|---|---|---|---|---|---|---|---|---|---|---|---|---|---|---|---|---|---|---|---|---|---|---|---|---|---|---|---|---|---|---|---|---|---|---|---|---|
| Registered | 3,302,016 | ||||||||||||||||||||||||||||||||||||
| Turnout | 2,987,200 (91.39%)[lower-alpha 2] ( | ||||||||||||||||||||||||||||||||||||
| |||||||||||||||||||||||||||||||||||||
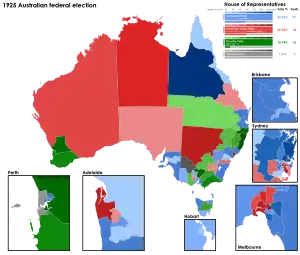
 Results by division for the House of Representatives, shaded by winning party's margin of victory. | |||||||||||||||||||||||||||||||||||||
| |||||||||||||||||||||||||||||||||||||
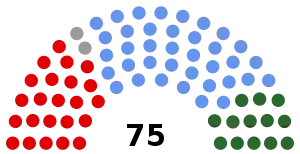
The 1925 Australian federal election was held in Australia on 14 November 1925. All 75 seats in the House of Representatives and 22 of the 36 seats in the Senate were up for election. The incumbent Nationalist–Country coalition, led by Prime Minister Stanley Bruce, defeated the opposition Labor Party led by Matthew Charlton in a landslide. This was the first time any party had won a fourth consecutive federal election.
Compulsory voting for federal elections was introduced in 1924 and first used in the 1925 elections, where 91.4% of the electorate cast a vote, compared to 59.4% at the 1922 elections.
Campaign
Prime Minister Stanley Bruce was a supporter of the White Australia Policy, and made it an issue in his campaign for the 1925 Australian Federal election.[1]
It is necessary that we should determine what are the ideals towards which every Australian would desire to strive. I think those ideals might well be stated as being to secure our national safety, and to ensure the maintenance of our White Australia Policy to continue as an integral portion of the British Empire.[1] We intend to keep this country white and not allow its people to be faced with the problems that at present are practically insoluble in many parts of the world.[2]
Results

House of Representatives
| Party | Votes | % | Swing | Seats | Change | ||
|---|---|---|---|---|---|---|---|
| Nationalist–Country coalition | 1,551,760 | 53.20 | +5.41 | 51 | +11 | ||
| Nationalist | 1,238,397 | 42.46 | +7.23 | 37 | +11 | ||
| Country | 313,363 | 10.74 | –1.82 | 13 | –1 | ||
| Labor | 1,313,627 | 45.04 | +2.74 | 24[lower-alpha 6] | –6 | ||
| Independents | 51,251 | 1.76 | –2.80 | 2 | +1 | ||
| Total | 2,916,638 | 76 | |||||
| Two-party-preferred (estimated) | |||||||
| Nationalist–Country coalition | Win | 53.80 | +2.60 | 51 | +11 | ||
| Labor | 46.20 | −2.60 | 23 | –6 | |||
- Notes
- Independents: Percy Stewart (Wimmera, Vic.), William Watson (Fremantle, WA).
- Labor lost Kennedy, Qld., when the sitting member Charles McDonald died on the day before the election, leading to his opponent Grosvenor Francis being declared elected unopposed.[3]
Senate
| Party | Votes | % | Swing | Seats won | Seats held | Change | ||
|---|---|---|---|---|---|---|---|---|
| Nationalist–Country coalition | 1,537,282 | 54.81 | N/A | 22 | 28 | N/A | ||
| Nationalist | 1,272,127 | 45.35 | +9.12 | 18 | 24 | 0 | ||
| Country | 265,155 | 9.45 | –3.53 | 4 | 4 | +4 | ||
| Labor | 1,262,912 | 45.02 | –0.67 | 0 | 8 | –4 | ||
| Independents | 4,808 | 0.17 | –1.87 | 0 | 0 | 0 | ||
| Total | 2,805,002 | 22 | 36 | |||||
Seats changing hands
| Seat | Pre-1925 | Swing | Post-1925 | ||||||
|---|---|---|---|---|---|---|---|---|---|
| Party | Member | Margin | Margin | Member | Party | ||||
| Angas, SA | Labor | Moses Gabb | 8.0 | 8.3 | 0.3 | Walter Parsons | Nationalist | ||
| Balaclava, Vic | Liberal | William Watt | 100.0 | 30.3 | 19.7 | William Watt | Nationalist | ||
| Barker, SA | Liberal | Malcolm Cameron | 2.3 | 9.3 | 11.6 | Malcolm Cameron | Nationalist | ||
| Barton, NSW | Labor | Frederick McDonald | 7.6 | 8.6 | 1.0 | Thomas Ley | Nationalist | ||
| Darwin, Tas | Country | Joshua Whitsitt | 0.4 | 10.9 | 10.5* | George Bell | Nationalist | ||
| Denison, Tas | Labor | David O'Keefe | 0.4 | 2.6 | 2.2 | John Gellibrand | Nationalist | ||
| Gwydir, NSW | Labor | Lou Cunningham | 0.1 | 3.2 | 3.1 | Aubrey Abbott | Country | ||
| Kennedy, Qld | Labor | Charles McDonald | N/A | 100.0 | 100.0 | Grosvenor Francis | Nationalist | ||
| Kooyong, Vic | Liberal | John Latham | 0.6 | 18.3 | 17.7 | John Latham | Nationalist | ||
| Wakefield, SA | Liberal | Richard Foster | 5.3 | 9.5 | 14.8 | Richard Foster | Nationalist | ||
| Wannon, Vic | Labor | John McNeill | 0.8 | 4.8 | 4.0 | Arthur Rodgers | Nationalist | ||
| Wimmera, Vic | Country | Percy Stewart | 21.2 | 77.8 | 27.8 | Percy Stewart | Independent | ||
- Members listed in italics did not contest their seat at this election.
- *Figure is Nationalist versus Labor.
See also
Notes
- ↑ The Northern Territory had one seat, but members for the territories did not have full voting rights until 1966 and did not count toward government formation.
- ↑ Turnout in contested seats
- ↑ As there was no formal Coalition between the Nationalist Party and the Country Party before the previous election, the seats were won by individual party. However, post-1922 election the two parties combined could form a majority in Parliament and formally announced a Coalition agreement.
- ↑ The Member for Wimmera (Percy Stewart) was represented as an "Independent Country" candidate.
- ↑ As Nationalist–Country Coalition. If separate parties, Nationalist: +11, Country –1.
- ↑ Including Northern Territory
References
- 1 2 "ISSUES OF THE ELECTIONS". The Age. No. 21, 999. Victoria, Australia. 6 October 1925. p. 11. Retrieved 9 December 2016 – via National Library of Australia.
- ↑ Bowen, James; Bowen, Margarita (2002). The Great Barrier Reef: History, Science, Heritage. Cambridge University Press. p. 301. ISBN 0-521-82430-3. Retrieved 24 January 2008.
- ↑ "Kennedy Seat". Brisbane Courier. 14 November 1925. p. 7. Retrieved 19 July 2010.
External links
- University of WA election results in Australia since 1890
- Two-party-preferred vote since 1919
- Compulsory Voting in Australia


