| |||||||||||||||||||||||||||||||||||||
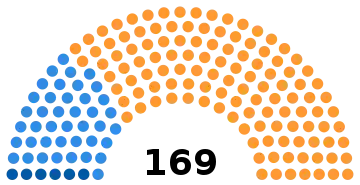
169 of the 171 seats in the House of Assembly 86 seats needed for a majority | |||||||||||||||||||||||||||||||||||||
|---|---|---|---|---|---|---|---|---|---|---|---|---|---|---|---|---|---|---|---|---|---|---|---|---|---|---|---|---|---|---|---|---|---|---|---|---|---|
| Turnout | 51.87% ( | ||||||||||||||||||||||||||||||||||||
| |||||||||||||||||||||||||||||||||||||
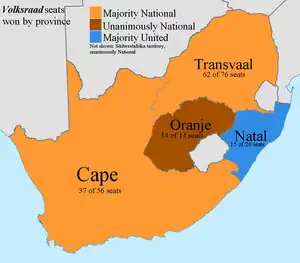
 Results by province | |||||||||||||||||||||||||||||||||||||
| |||||||||||||||||||||||||||||||||||||
.svg.png.webp) |
|---|
|
|
General elections were held in South Africa on 24 April 1974. They were called one year earlier than scheduled by Prime Minister John Vorster on 4 February. The House of Assembly was increased from 166 to 171 members. The election was once again won by the National Party, with a slightly increased parliamentary majority.
The Progressive Party made a major advance, however. In addition to Helen Suzman, re-elected for Houghton, five other members won seats including the party leader Colin Eglin. A seventh member of the caucus was elected at a by-election soon after. The United Party won 41 seats. The election also saw Harry Schwarz, leader of the United Party in the Transvaal, enter Parliament. Schwartz would soon lead a break away from the United Party and would become one of the Apartheid's more prominent opponents in Parliament, first forming the Reform Party and then joining with the Progressive Party to form the Progressive Reform Party in 1975, under the leadership of Colin Eglin.
Nominations
Nominations closed on 18 March. A total of 334 candidates were nominated for 171 seats: National Party 137, United Party 110, Herstigte Nasionale Party 46, Progressive Party 23, Democratic Party 7 and others 11.[1] 46 seats were won unopposed, 32 for the National Party and 14 for the United Party.
Results
House of Assembly
125 of the 171 seats were contested.[2] Voting did not take place in two constituencies, Pinelands and Wonderboom, where by-elections were later held; Pinelands was won by the Progressive Party and Wonderboom by the National Party.[3]
 | |||||
|---|---|---|---|---|---|
| Party | Votes | % | Seats | +/– | |
| National Party | 638,424 | 56.14 | 122 | +5 | |
| United Party | 363,478 | 31.96 | 41 | –6 | |
| Progressive Party | 72,479 | 6.37 | 6 | +5 | |
| Herstigte Nasionale Party | 44,717 | 3.93 | 0 | 0 | |
| Democratic Party | 10,050 | 0.88 | 0 | New | |
| Others | 5,471 | 0.48 | 0 | 0 | |
| Independents | 2,532 | 0.22 | 0 | 0 | |
| Vacant | 2 | – | |||
| Total | 1,137,151 | 100.00 | 171 | +5 | |
| Valid votes | 1,137,151 | 98.19 | |||
| Invalid/blank votes | 20,923 | 1.81 | |||
| Total votes | 1,158,074 | 100.00 | |||
| Registered voters/turnout | 2,232,623 | 51.87 | |||
| Source: Official Yearbook[4] New York Times | |||||
By province
| Province | National | United | Progressive | Total |
|---|---|---|---|---|
| Transvaal | 62 | 11 | 4 | 76 |
| Cape | 37 | 15 | 3 | 56 |
| Natal | 5 | 15 | 0 | 20 |
| Orange Free State | 14 | 0 | 0 | 14 |
| South-West Africa | 5 | 0 | 0 | 5 |
| Total | 123 | 41 | 7 | 171 |
| Source: Stadler[5] | ||||
Senate
The elections for the Senate were held on 30 May 1974 by an electoral college made up of members of the Assembly and various others. The National Party gained one seat at the expense of the United Party, winning 32 of the 44 seats (the United Party held 12 seats).
| Party | Seats | +/– | |
|---|---|---|---|
| National Party | 32 | +1 | |
| United Party | 12 | –1 | |
| Total | 44 | 0 | |
References
- ↑ "General South African History Timeline: 1970s | South African History Online". Archived from the original on 14 January 2019. Retrieved 1 September 2012.
- ↑ South Africa Inter-Parliamentary Union
- ↑ Terry Eksteen (1982) The Decline of the United Party 1970–1977
- ↑ South Africa: Official Yearbook of the Republic of South Africa, 1985, p180–182
- ↑ Stadler, A. W. (1975), "The 1974 General Election in South Africa" (PDF), African Affairs, 74 (295): 209–218, doi:10.1093/oxfordjournals.afraf.a096587, JSTOR 721184


.jpg.webp)