| |||||||||||||||||||||||||||||||||||||||||||||||||||||||||||||||||||||||||||||||||||||||||||||
12 seats to the European Parliament | |||||||||||||||||||||||||||||||||||||||||||||||||||||||||||||||||||||||||||||||||||||||||||||
|---|---|---|---|---|---|---|---|---|---|---|---|---|---|---|---|---|---|---|---|---|---|---|---|---|---|---|---|---|---|---|---|---|---|---|---|---|---|---|---|---|---|---|---|---|---|---|---|---|---|---|---|---|---|---|---|---|---|---|---|---|---|---|---|---|---|---|---|---|---|---|---|---|---|---|---|---|---|---|---|---|---|---|---|---|---|---|---|---|---|---|---|---|---|
| Turnout | 57.5% | ||||||||||||||||||||||||||||||||||||||||||||||||||||||||||||||||||||||||||||||||||||||||||||
| |||||||||||||||||||||||||||||||||||||||||||||||||||||||||||||||||||||||||||||||||||||||||||||
 Colours indicate winning party. | |||||||||||||||||||||||||||||||||||||||||||||||||||||||||||||||||||||||||||||||||||||||||||||
The 2009 European Parliament election in Ireland was the Irish component of the 2009 European Parliament election and was held on Friday, 5 June 2009, coinciding with the 2009 local elections. Two by-elections (Dublin South and Dublin Central) were also held on the same day.[1]
National and regional summaries
The governing Fianna Fáil party lost one MEP and a significant share of the vote, in line with the day's other election results. Fine Gael increased its national vote share but lost a seat. The Labour Party, which increased its delegation from one MEP to three, was the only major party to make seat gains. Sinn Féin lost its only MEP in the Republic of Ireland, and the Socialist Party won a seat for the first time. One independent MEP lost her seat. The Green Party's vote was halved, and the pan-European Libertas party, based in Ireland, also failed to make a breakthrough.
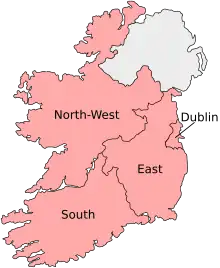
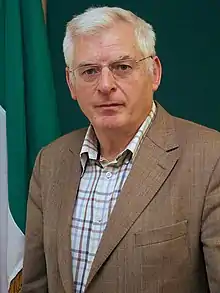
In Dublin, Gay Mitchell of Fine Gael and Proinsias De Rossa of Labour were re-elected, while Joe Higgins of the Socialist Party defeated the incumbent Fianna Fáil and Sinn Féin MEPs to take the third seat. In the East constituency, Mairead McGuinness of Fine Gael and Liam Aylward of Fianna Fáil were re-elected. Nessa Childers of Labour took the vacant final seat. North-West re-elected independent ALDE MEP Marian Harkin and Jim Higgins of Fine Gael, while the Fianna Fáil seat was retained by former MEP Pat "the Cope" Gallagher. In South, Brian Crowley of Fianna Fáil was re-elected, Seán Kelly won a seat from his Fine Gael colleague Colm Burke, and Labour's Alan Kelly took the last seat in a tight contest between him, Sinn Féin's Toiréasa Ferris and the incumbent Independent Kathy Sinnott in the final count.[2]
Constituency changes
In accordance with the terms of the Treaty of Nice, the number of MEPs from Ireland in the European Parliament was reduced from 13 to 12 for this election. The Dublin constituency was reduced from 4 seats to 3, and the counties of Longford and Westmeath were transferred from the East constituency to the North-West constituency. The election was conducted under the single transferable vote in Ireland; the only other constituencies to elect their MEPs under STV are Malta and Northern Ireland, with the rest of Europe using variants of the list system.
Results
| Members of the European Parliament for Ireland | |
|---|---|
| 1st delegation | (1973) |
| 2nd delegation | (1973–1977) |
| 3rd delegation | (1977–1979) |
| 1st term | (1979) |
| 2nd term | (1984) |
| 3rd term | (1989) |
| 4th term | (1994) |
| 5th term | (1999) |
| 6th term | (2004) |
| 7th term | (2009) |
| 8th term | (2014) |
| 9th term | (2019) |
| 10th term | (2024) |
| List of women MEPs | |

| Party | European party | Party leader | First pref vote | % | ±% | Seats | ± | |
|---|---|---|---|---|---|---|---|---|
| Fine Gael | EPP | Enda Kenny | 532,889 | 29.1 | 4 | |||
| Fianna Fáil | ALDE | Brian Cowen | 440,562 | 24.1 | 3 | |||
| Labour Party | S&D | Eamon Gilmore | 254,669 | 13.9 | 3 | |||
| Socialist Party | GUE/NGL | Joe Higgins | 50,510[4] | 2.7 | 1 | |||
| Sinn Féin | GUE/NGL | Gerry Adams | 205,613 | 11.2 | 0 | |||
| Libertas | EFD | Declan Ganley | 99,709 | 5.4 | 0 | ±0 | ||
| Green Party | Greens/EFA | John Gormley | 34,585 | 1.9 | 0 | ±0 | ||
| Independent | 210,776 | 11.5 | 1 | |||||
| Total | 1,829,313 | 100 | — | 12 | −1 | |||
MEPs elected
Voting details
| Constituency | Electorate | Turnout | Spoilt | Valid Poll | Quota | Seats | Candidates |
|---|---|---|---|---|---|---|---|
| Dublin | 812,465 | 412,684 (50.8%) | 6,054 (1.5%) | 406,630 | 101,658 | 3 | 10 |
| East | 778,502 | 442,291 (56.8%) | 13,042 (2.9%) | 429,249 | 107,313 | 3 | 11 |
| North-West | 805,626 | 510,982 (63.4%) | 15,675 (3.1%) | 495,307 | 123,827 | 3 | 13 |
| South | 861,727 | 509,963 (59.2%) | 11,836 (2.3%) | 498,127 | 124,532 | 3 | 10 |
| Total | 3,258,320 | 1,875,920 (57.5%) | 46,607 (2.5%) | 1,829,313 | — | 12 | 44 |
See also
- List of members of the European Parliament for Ireland, 2009–14 – List ordered by constituency
References
- ↑ "By-elections set for June 5th". The Irish Times. 28 April 2009. Retrieved 29 April 2009.
- ↑ Riegel, Ralph (9 June 2009). "Labour's Kelly fights off late Sinnott surge". Irish Independent. Retrieved 15 June 2009.
- ↑ "Elections 2009 – European Elections – National Summary". RTÉ News. Archived from the original on 11 June 2009. Retrieved 13 June 2009.
- ↑ "Elections 2009 – European Elections – Dublin". RTÉ News. Archived from the original on 9 June 2009. Retrieved 13 June 2009.
.jpg.webp)
.jpg.webp)
.jpg.webp)

.jpg.webp)
