| ||
|
| ||
| Elections in Tennessee |
|---|
 |
|
|
Tennessee state elections in 2012 were held on Tuesday, November 6, 2012. Primary elections for the United States Senate, United States House of Representatives, Tennessee Senate, and Tennessee House of Representatives, as well as various judicial retention elections, were held on August 2, 2012.
Presidential election
President of the United States
- 50–60%
-
60–70%
- 70–80%
- 50–60%
- 60–70%
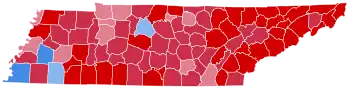
In 2012, Tennessee was a stronghold for the Republican Party, and was considered a reliable "red state." Tennessee had 11 electoral votes in the Electoral college at the time. In the general election, Republican candidate Mitt Romney won the state with 59.42% of the vote in the state to Democratic President Obama's 39.04%.
The presidential primaries were held on March 6, 2012. Rick Santorum won Tennessee's Republican primary over former governor Mitt Romney of Massachusetts. Incumbent President Barack Obama won the Democratic primary, running unopposed.
Results
| Party | Candidate | Running mate | Votes | Percentage | Electoral votes | |
|---|---|---|---|---|---|---|
| Republican | Mitt Romney | Paul Ryan | 1,462,330 | 59.42% | 11 | |
| Democratic | Barack Obama | Joe Biden | 960,709 | 39.04% | 0 | |
| Libertarian | Gary Johnson | Jim Gray | 18,623 | 0.67% | 0 | |
| Green | Jill Stein | Cheri Honkala | 6,515 | 0.26% | 0 | |
| Constitution | Virgil Goode | Jim Clymer | 6,022 | 0.24% | 0 | |
| Justice | Rocky Anderson | Luis J. Rodriguez | 2,639 | 0.11% | 0 | |
| American Third Position | Merlin Miller | Virginia D. Abernethy | 1,739 | 0.07% | 0 | |
| Totals | 2,458,577 | 100.00% | 11 | |||
March 6, 2012, Primary Results
| |||||||||||||||||||
| |||||||||||||||||||
 Tennessee results by county
Barack Obama | |||||||||||||||||||

| |||||||||||||||||||||||||||||||||||||||||
| |||||||||||||||||||||||||||||||||||||||||
 Tennessee results by county
Rick Santorum
Mitt Romney
Newt Gingrich | |||||||||||||||||||||||||||||||||||||||||


.jpg.webp)
.jpg.webp)
United States Congress
Senate

- 40–50%
- 50–60%
- 60–70%
- 70–80%
- 80–90%
- 50–60%
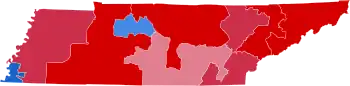
Incumbent Republican U.S. Senator Bob Corker won a second term in a landslide, carrying all but two counties in the state.
Results
| Party | Candidate | Votes | % | ±% | |
|---|---|---|---|---|---|
| Republican | Bob Corker (incumbent) | 1,506,443 | 64.89% | +14.18% | |
| Democratic | Mark Clayton | 705,882 | 30.41% | -17.59% | |
| Green | Martin Pleasant | 38,472 | 1.66% | +1.52% | |
| Independent | Shaun Crowell | 20,936 | 0.90% | N/A | |
| Constitution | Kermit Steck | 18,620 | 0.80% | N/A | |
| Independent | James Higdon | 8,085 | 0.35% | N/A | |
| Independent | Michael Joseph Long | 8,080 | 0.35% | N/A | |
| Independent | Troy Stephen Scoggin | 7,148 | 0.31% | N/A | |
| Independent | David Gatchell | 6,523 | 0.28% | N/A | |
| n/a | Write-ins | 1,288 | 0.05% | N/A | |
| Total votes | 2,321,477 | 100.00% | N/A | ||
| Republican hold | |||||
August 2, 2012, Primary Results

| Party | Candidate | Votes | % | |
|---|---|---|---|---|
| Democratic | Mark E. Clayton | 48,126 | 29.99% | |
| Democratic | Gary Gene Davis | 24,789 | 15.45% | |
| Democratic | Park Overall | 24,263 | 15.12% | |
| Democratic | Larry Crim | 17,383 | 10.83% | |
| Democratic | Benjamin Roberts | 16,369 | 10.20% | |
| Democratic | David Hancock | 16,167 | 10.08 | |
| Democratic | Thomas Owens | 13,366 | 8.33 | |
| Total votes | 160,463 | 100.00 | ||
| Party | Candidate | Votes | % | |
|---|---|---|---|---|
| Republican | Bob Corker (Incumbent) | 389,483 | 85.25% | |
| Republican | Zach Poskevich | 28,299 | 6.19% | |
| Republican | Fred Anderson | 15,942 | 3.49% | |
| Republican | Mark Twain Clemens | 11,788 | 2.58% | |
| Republican | Brenda Lenard | 11,378 | 2.49% | |
| Total votes | 456,890 | 100.00% | ||
House of Representatives
- 50–60%
- 60–70%
- 70–80%
- 60–70%
- 70–80%
Tennessee elected nine U.S. representatives, each representing one of Tennessee's nine congressional districts.
Results
| District | Incumbent | Party | First elected |
Result | Candidates |
|---|---|---|---|---|---|
| Tennessee 1 | Phil Roe | Republican | 2008 | Incumbent re-elected. |
|
| Tennessee 2 | Jimmy Duncan | Republican | 1988 (Special) | Incumbent re-elected. |
|
| Tennessee 3 | Chuck Fleischmann | Republican | 2010 | Incumbent re-elected. |
|
| Tennessee 4 | Scott DesJarlais | Republican | 2010 | Incumbent re-elected. |
|
| Tennessee 5 | Jim Cooper | Democratic | 1982 1994 (retired) 2002 |
Incumbent re-elected. |
|
| Tennessee 6 | Diane Black | Republican | 2010 | Incumbent re-elected. |
|
| Tennessee 7 | Marsha Blackburn | Republican | 2002 | Incumbent re-elected. |
|
| Tennessee 8 | Stephen Fincher | Republican | 2010 | Incumbent re-elected. |
|
| Tennessee 9 | Steve Cohen | Democratic | 2006 | Incumbent re-elected. |
|
State Legislature
State Senate
Elections for 16 of the 33 seats in Tennessee's State Senate were held on November 6, 2012.
After this election, Republicans had 26 seats while Democrats had 7 seats, with Republicans gaining six seats.
State House of Representatives
The election of all 99 seats in the Tennessee House of Representatives occurred on November 6, 2012.
Republicans won 71 seats, while Democrats won 27 seats, and Independents won 1 seat. Republicans gained seven seats during this election.
See also
References
- ↑ State of Tennessee. November 6, 2012. General Election
- 1 2 "Tennessee Secretary of State Unofficial Election Results". Secretary of State of Tennessee. Retrieved August 2, 2012.