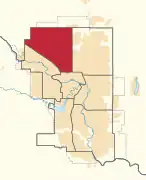
.svg.png.webp) Boundaries of Calgary—Nose Hill as of the 2013 Representation Order | |||
| Federal electoral district | |||
| Legislature | House of Commons | ||
| MP |
Conservative | ||
| District created | 1996 | ||
| First contested | 1997 | ||
| Last contested | 2021 | ||
| District webpage | profile, map | ||
| Demographics | |||
| Population (2011)[1] | 109,286 | ||
| Electors (2019) | 83,064 | ||
| Area (km²)[2] | 57 | ||
| Pop. density (per km²) | 1,917.3 | ||
| Census division(s) | Division No. 6 | ||
| Census subdivision(s) | Calgary | ||
Calgary Nose Hill (formerly Calgary—Nose Hill) is a federal electoral district in Alberta, Canada, that has been represented in the House of Commons of Canada since 1997.
Geography
It consists of the part of the City of Calgary clockwise within the following line: from the northern limit of the city along: Centre Street North, Harvest Hills Boulevard North, Beddington Trail NW, Deerfoot Trail, McKnight Boulevard, John Laurie Boulevard NW, Sarcee Trail, Stoney Trail, 14 Street north to the northern limit of the city.
Demographics
- According to the Canada 2011 Census[3]
Languages: 78.0% English, 12.9% Chinese, 1.0% Punjabi, 1.0% Spanish, 7.1% Other
Religions: 52.2% Christian, 4.9% Muslim, 3.3% Buddhist, 1.9% Hindu, 1.4% Sikh, 0.6% Other, 35.7% None
Median income: $37,048 (2010)
Average income: $51,586 (2010)
| Panethnic group |
2021[4] | 2016[5] | 2011[6] | |||||||||||
|---|---|---|---|---|---|---|---|---|---|---|---|---|---|---|
| Pop. | % | Pop. | % | Pop. | % | |||||||||
| European[lower-alpha 1] | 52,165 | 45.33% | 58,545 | 50.66% | 62,285 | 57.1% | ||||||||
| East Asian[lower-alpha 2] | 25,000 | 21.72% | 25,875 | 22.39% | 22,890 | 20.98% | ||||||||
| South Asian | 10,615 | 9.22% | 9,695 | 8.39% | 7,625 | 6.99% | ||||||||
| African | 7,535 | 6.55% | 5,190 | 4.49% | 3,010 | 2.76% | ||||||||
| Southeast Asian[lower-alpha 3] | 7,335 | 6.37% | 6,115 | 5.29% | 5,395 | 4.95% | ||||||||
| Middle Eastern[lower-alpha 4] | 4,050 | 3.52% | 3,305 | 2.86% | 2,350 | 2.15% | ||||||||
| Indigenous | 3,285 | 2.85% | 2,685 | 2.32% | 2,790 | 2.56% | ||||||||
| Latin American | 2,620 | 2.28% | 2,290 | 1.98% | 1,425 | 1.31% | ||||||||
| Other/Multiracial[lower-alpha 5] | 2,490 | 2.16% | 1,855 | 1.61% | 1,300 | 1.19% | ||||||||
| Total responses | 115,080 | 99.82% | 115,560 | 99.8% | 109,080 | 99.81% | ||||||||
| Total population | 115,287 | 100% | 115,795 | 100% | 109,286 | 100% | ||||||||
| Notes: Totals greater than 100% due to multiple origin responses. Demographics based on 2012 Canadian federal electoral redistribution riding boundaries. | ||||||||||||||
History
This riding was created in 1996 from Calgary North and Wild Rose ridings.
In 2003, parts of this electoral district were transferred to Calgary Centre-North riding.
In the 2012 federal electoral boundaries redistribution Calgary—Nose Hill lost the emdash in its name. It also lost all of its territory north of Stoney Trail and west of Sarcee Trail and John Laurie Blvd to the new riding of Calgary Rocky Ridge, while gaining back the area north of a line following John Laurie Blvd to McKnight Blvd from Calgary Centre-North.[7] This was legally defined in the 2013 representation order and came into effect upon the call of the October 19, 2015 42nd Canadian federal election.[8]
Historical boundaries
 1996 representation order
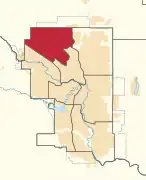 2003 representation order
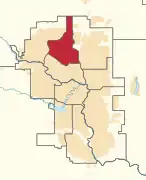 2013 representation order
Members of Parliament
This riding has elected the following Members of Parliament:
| Parliament | Years | Member | Party | |
|---|---|---|---|---|
| Calgary—Nose Hill Riding created from Calgary North and Wild Rose |
||||
| 36th | 1997–2000[nb 1] | Diane Ablonczy | Reform | |
| 2000–2000 | Alliance | |||
| 37th | 2000–2003[nb 2] | |||
| 2003–2004 | Conservative | |||
| 38th | 2004–2006 | |||
| 39th | 2006–2008 | |||
| 40th | 2008–2011 | |||
| 41st | 2011–2015 | |||
| Calgary Nose Hill | ||||
| 42nd | 2015–2019 | Michelle Rempel Garner | Conservative | |
| 43rd | 2019–2021 | |||
| 44th | 2021–present | |||
Election results
Calgary Nose Hill (2013-present)
| 2021 Canadian federal election | ||||||||
|---|---|---|---|---|---|---|---|---|
| Party | Candidate | Votes | % | ±% | Expenditures | |||
| Conservative | Michelle Rempel Garner | 28,001 | 55.56 | -14.21 | $107,523.71 | |||
| Liberal | Jessica Dale-Walker | 10,311 | 20.46 | +4.73 | $3,523.58 | |||
| New Democratic | Khalis Ahmed | 8,500 | 16.87 | +7.28 | $0.00 | |||
| People's | Kyle Scott | 2,324 | 4.61 | +2.64 | $4,866.70 | |||
| Green | Judson Hansell | 636 | 1.26 | -1.55 | $0.00 | |||
| Rhinoceros | Vanessa Wang | 285 | 0.57 | - | $0.00 | |||
| Christian Heritage | Larry R. Heather | 169 | 0.33 | - | $4,063.95 | |||
| Marxist–Leninist | Peggy Askin | 105 | 0.21 | +0.08 | $0.00 | |||
| National Citizens Alliance | Stephen J. Garvey | 62 | 0.1 | - | $321.06 | |||
| Total valid votes/Expense limit | 50,393 | 100.0 | – | $112,642.54 | ||||
| Total rejected ballots | 321 | |||||||
| Turnout | 50,714 | 61.67 | ||||||
| Eligible voters | 82,832 | |||||||
| Conservative hold | Swing | -9.47 | ||||||
| Source: Elections Canada[9] | ||||||||
| 2019 Canadian federal election | ||||||||
|---|---|---|---|---|---|---|---|---|
| Party | Candidate | Votes | % | ±% | Expenditures | |||
| Conservative | Michelle Rempel | 38,588 | 69.77 | +9.76 | $102,084.53 | |||
| Liberal | Josephine Tsang | 8,703 | 15.73 | -11.19 | $13,026.69 | |||
| New Democratic | Patrick King | 5,304 | 9.59 | +0.74 | $7,442.59 | |||
| Green | Jocelyn Grossé | 1,554 | 2.81 | +0.26 | none listed | |||
| People's | Kelly Lorencz | 1,089 | 1.97 | - | none listed | |||
| Marxist–Leninist | Peggy Askin | 71 | 0.13 | - | $0.00 | |||
| Total valid votes/expense limit | 55,309 | 100.0 | ||||||
| Total rejected ballots | 262 | |||||||
| Turnout | 55,571 | 66.9 | ||||||
| Eligible voters | 83,064 | |||||||
| Conservative hold | Swing | +10.48 | ||||||
| Source: Elections Canada[10][11] | ||||||||
| 2015 Canadian federal election | ||||||||
|---|---|---|---|---|---|---|---|---|
| Party | Candidate | Votes | % | ±% | Expenditures | |||
| Conservative | Michelle Rempel | 32,760 | 60.04 | –9.25 | $106,493.93 | |||
| Liberal | Robert Prcic | 14,671 | 26.89 | +15.84 | $4,646.34 | |||
| New Democratic | Bruce Kaufman | 4,836 | 8.86 | –3.92 | $17,607.32 | |||
| Green | Laurie Scheer | 1,384 | 2.54 | –4.21 | $2,630.75 | |||
| Libertarian | Edward Gao | 727 | 1.33 | – | $1,101.19 | |||
| Democratic Advancement | Faizan Butt | 184 | 0.34 | – | – | |||
| Total valid votes/expense limit | 54,562 | 100.00 | $217,293.27 | |||||
| Total rejected ballots | 255 | 0.47 | – | |||||
| Turnout | 54,817 | 67.19 | – | |||||
| Eligible voters | 81,582 | |||||||
| Conservative hold | Swing | –12.54 | ||||||
| Source: Elections Canada[12][13] | ||||||||
Calgary—Nose Hill (1996-2013)
| 2011 Canadian federal election | ||||||||
|---|---|---|---|---|---|---|---|---|
| Party | Candidate | Votes | % | ±% | Expenditures | |||
| Conservative | Diane Ablonczy | 40,384 | 70.17 | +0.54 | $60,393 | |||
| New Democratic | Collin Anderson | 7,189 | 12.49 | +4.63 | ||||
| Liberal | Margaret McLeod | 6,501 | 11.30 | -1.93 | $34,065 | |||
| Green | Tony Hajj | 3,480 | 6.05 | -3.23 | $10,363 | |||
| Total valid votes/expense limit | 57,554 | 100.00 | – | $101,293 | ||||
| Total rejected ballots | 169 | 0.29 | – | |||||
| Turnout | 57,723 | 57.35 | – | |||||
| Eligible voters | 100,656 | – | – | |||||
| 2008 Canadian federal election | ||||||||
|---|---|---|---|---|---|---|---|---|
| Party | Candidate | Votes | % | ±% | Expenditures | |||
| Conservative | Diane Ablonczy | 35,029 | 69.63 | +1.15 | $53,757 | |||
| Liberal | Anoush Newman | 6,653 | 13.23 | -3.87 | $9,605 | |||
| Green | Tony Hajj | 4,669 | 9.28 | +2.81 | $6,945 | |||
| New Democratic | Stephanie Sundberg | 3,953 | 7.86 | -0.08 | $853 | |||
| Total valid votes/expense limit | 50,304 | 100.00 | $93,719 | |||||
| Total rejected ballots | – | |||||||
| Turnout | – | |||||||
| 2006 Canadian federal election: Calgary—Nose Hill | ||||||||
|---|---|---|---|---|---|---|---|---|
| Party | Candidate | Votes | % | ±% | Expenditures | |||
| Conservative | Diane Ablonczy | 37,815 | 68.48 | +4.10 | $56,089 | |||
| Liberal | Ted Haney | 9,443 | 17.10 | -5.78 | $59,767 | |||
| New Democratic Party | Bruce Kaufman | 4,385 | 7.94 | +1.21 | $6,417 | |||
| Green | Juliet Burgess | 3,573 | 6.47 | +0.47 | $606 | |||
| Total valid votes | 55,216 | 100.00 | ||||||
| Total rejected ballots | 130 | 0.23 | ||||||
| Turnout | 55,346 | 63.83 | ||||||
| 2004 Canadian federal election: Calgary—Nose Hill | ||||||||
|---|---|---|---|---|---|---|---|---|
| Party | Candidate | Votes | % | ±% | Expenditures | |||
| Conservative | Diane Ablonczy | 31,088 | 64.38 | -10.30 | $56,902 | |||
| Liberal | Ted Haney | 11,051 | 22.88 | +3.46 | $49,767 | |||
| New Democratic Party | Vinay Dey | 3,250 | 6.73 | +3.01 | $4,146 | |||
| Green | Richard Larson | 2,898 | 6.00 | +4.18 | $570 | |||
| Total valid votes | 48,287 | 100.00 | ||||||
| Total rejected ballots | 131 | 0.27 | ||||||
| Turnout | 48,418 | 61.21 | ||||||
| 2000 Canadian federal election: Calgary—Nose Hill | ||||||||
|---|---|---|---|---|---|---|---|---|
| Party | Candidate | Votes | % | ±% | Expenditures | |||
| Alliance | Diane Ablonczy | 35,904 | 60.12 | +8.33 | $59,338 | |||
| Liberal | Brian Thiessen | 11,602 | 19.42 | -5.81 | $20,306 | |||
| Progressive Conservative | James F. McArdle | 8,696 | 14.56 | -2.86 | $5,320 | |||
| New Democratic | Jon Adams | 2,227 | 3.72 | -0.06 | $893 | |||
| Green | Andrew Pickles | 1,092 | 1.82 | +0.55 | $2,410 | |||
| Canadian Action | Maureen Ann Roberts | 194 | 0.32 | – | $2,411 | |||
| Total valid votes | 59,715 | |||||||
| Total rejected ballots | 123 | 0.21 | ||||||
| Turnout | 59,838 | 59.51 | ||||||
| 1997 Canadian federal election: Calgary—Nose Hill | ||||||||
|---|---|---|---|---|---|---|---|---|
| Party | Candidate | Votes | % | ±% | Expenditures | |||
| Reform | Diane Ablonczy | 25,788 | 51.79 | $64,740 | ||||
| Liberal | James Maxim | 12,565 | 25.23 | $47,359 | ||||
| Progressive Conservative | Pat Murray | 8,678 | 17.42 | $53,211 | ||||
| New Democratic Party | Andrea Garnier | 1,883 | 3.78 | $1,278 | ||||
| Green | Frank Young | 637 | 1.27 | – | $1,631 | |||
| Natural Law | Gloria Hansen | 237 | 0.47 | $103 | ||||
| Total valid votes | 49,788 | 100.00 | ||||||
| Total rejected ballots | 102 | 0.20 | ||||||
| Turnout | 49,890 | 64.88 | ||||||
Adjacent ridings
See also
Notes
- ↑ Statistic includes all persons that did not make up part of a visible minority or an indigenous identity.
- ↑ Statistic includes total responses of "Chinese", "Korean", and "Japanese" under visible minority section on census.
- ↑ Statistic includes total responses of "Filipino" and "Southeast Asian" under visible minority section on census.
- ↑ Statistic includes total responses of "West Asian" and "Arab" under visible minority section on census.
- ↑ Statistic includes total responses of "Visible minority, n.i.e." and "Multiple visible minorities" under visible minority section on census.
References
- ↑ Statistics Canada: 2011
- ↑ Statistics Canada: 2011
- ↑ "2011 National Household Survey Profile - Federal electoral district (2013 Representation Order)". May 8, 2013.
- ↑ Government of Canada, Statistics Canada (October 26, 2022). "Census Profile, 2021 Census of Population". www12.statcan.gc.ca. Retrieved March 26, 2023.
- ↑ Government of Canada, Statistics Canada (October 27, 2021). "Census Profile, 2016 Census". www12.statcan.gc.ca. Retrieved March 26, 2023.
- ↑ Government of Canada, Statistics Canada (November 27, 2015). "NHS Profile". www12.statcan.gc.ca. Retrieved March 26, 2023.
- ↑ Report – Alberta
- ↑ Timeline for the Redistribution of Federal Electoral Districts
- ↑ "Election Night Results - Electoral Districts".
- ↑ "List of confirmed candidates". Elections Canada. Retrieved October 4, 2019.
- ↑ "Election Night Results". Elections Canada. Retrieved November 7, 2019.
- ↑ "October 19, 2015 Election Results — Calgary Nose Hill (Validated results)". Elections Canada. October 21, 2015. Retrieved November 4, 2015.
- ↑ Elections Canada – Preliminary Election Expenses Limits for Candidates Archived 2016-03-04 at the Wayback Machine
- "Calgary Nose Hill (Code 48005) Census Profile". 2011 census. Government of Canada - Statistics Canada. Retrieved March 6, 2011.
- Riding history for Calgary Nose Hill from the Library of Parliament
- Expenditures - 2008
- Expenditures - 2004
- Expenditures - 2000
- Expenditures - 1997
External links
- Elections Canada
- Website of the Parliament of Canada