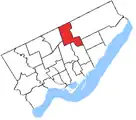
.png.webp) Don Valley East in relation to other electoral districts in Toronto (2013 boundaries) | |||
| Federal electoral district | |||
| Legislature | House of Commons | ||
| MP |
Liberal | ||
| District created | 1976 | ||
| First contested | 1979 | ||
| Last contested | 2021 | ||
| District webpage | profile, map | ||
| Demographics | |||
| Population (2021)[1] | 95,039 | ||
| Electors (2019) | 65,793 | ||
| Area (km²)[2] | 24 | ||
| Pop. density (per km²) | 3,960 | ||
| Census division(s) | Toronto | ||
| Census subdivision(s) | Toronto | ||
.gif)
Don Valley East (French: Don Valley-Est) is a federal electoral district in Ontario, Canada that covers the northeast section of the North York part of Toronto. The federal riding was created in 1976 from parts of Willowdale, York East, York North, and York—Scarborough ridings.
It is represented in the House of Commons of Canada by Liberal MP Michael Coteau. He was formerly the Ontario Liberal MPP for the contiguous provincial riding.
Geography
This riding is located in the eastern part of the North York district in Toronto. It contains the neighbourhoods of Flemingdon Park, Don Mills, Graydon Hall, Parkwoods and Victoria Village.
History
For most of its existence, this riding has alternated between voting Liberal and Conservative. During the Brian Mulroney years, it elected Progressive Conservatives but it switched to Liberal when Jean Chrétien came to power. In 2011, when Stephen Harper's Conservative Party won a majority government, the riding switched back to Conservative.
In 2018 the Don Valley East Collective was created to organize & inform residents around important issues that impact our daily lives; this group spans all of the neighbourhoods within Don Valley East.
Robocall controversy
Don Valley East was one of the seven federal ridings for which the election results were being challenged in court because of automated phone calls ("robocalls") that voters say tried to misdirect them to wrong polling stations. According to the challenger's claims, phone calls claiming to be on behalf of Elections Canada directed some voters to the wrong polling station during the election. It is illegal under the Elections Act to impersonate Elections Canada and to interfere with somebody's right to vote.[3]
In October 2012, however, Don Valley East was dropped from the legal case after it was found that Leeanne Bielli, the voter who brought the challenge forward, did not live in the riding. Bielli therefore became ineligible to challenge the result.[4] Joe Daniel remained the Member of Parliament for Don Valley East until the 2015 federal election.
Boundaries
As of changes made in 2003, the riding boundaries consisted of:
- on the east by Victoria Park Avenue,
- on the north by the hydroelectric transmission line situated north of Apache Trail running west from Victoria Park Avenue to Highway No. 404, then along that highway to Finch Avenue East, and west along Finch Avenue to Leslie Street;
- on the west by Leslie Street as far as the Canadian National Railway, then by the railway to Don Mills Road, then south along Don Mills Road to the Canadian Pacific Railway, then northeast along the railway to the Don River East Branch, and south along the Don River to just west of Sunrise Avenue, and
- on the south by Sunrise Avenue.
This riding underwent significant changes during the 2012 electoral redistribution. It lost almost half of its territory to Don Valley North and gained a significant portion of Don Valley West.
Former boundaries
 1976 to 1987
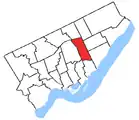 1987 to 1996
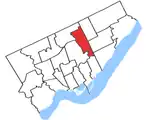 1996 to 2003
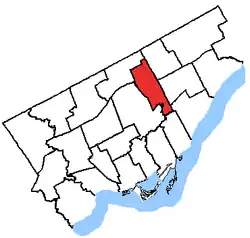 2003 to 2015
Demographics
According to the Canada 2021 Census[5]
Languages: 44.0% English, 3.6% Tagalog, 3.5% Arabic, 3.1% Mandarin, 2.7% Urdu, 2.3% Spanish, 2.2% Cantonese, 2.1% Greek, 2.0% Dari, 2.0% Gujarati, 1.6% Persian, 1.3% Romanian, 1.2% Tamil, 1.2% Bengali, 1.1% Hindi, 1.0% Korean
Religions: 47.9% Christian (19.9% Catholic, 7.7% Christian Orthodox, 2.4% Anglican, 2.0% United Church, 1.2% Presbyterian, 1.1% Pentecostal, 13.6% Other), 22.3% Muslim, 4.5% Hindu, 1.2% Buddhist, 22.1% None
Median income: $36,400 (2020)
Average income: $50,680 (2020)
-
| Panethnic group | 2021[6] | 2016[7] | 2011[8] | |||||||||||
|---|---|---|---|---|---|---|---|---|---|---|---|---|---|---|
| Pop. | % | Pop. | % | Pop. | % | |||||||||
| European[lower-alpha 1] | 34,255 | 36.31% | 38,125 | 40.92% | 39,930 | 43.31% | ||||||||
| South Asian | 17,285 | 18.32% | 15,890 | 17.05% | 15,140 | 16.42% | ||||||||
| African | 9,880 | 10.47% | 8,665 | 9.3% | 8,390 | 9.1% | ||||||||
| East Asian[lower-alpha 2] | 9,280 | 9.84% | 8,880 | 9.53% | 9,520 | 10.32% | ||||||||
| Middle Eastern[lower-alpha 3] | 9,120 | 9.67% | 8,480 | 9.1% | 7,555 | 8.19% | ||||||||
| Southeast Asian[lower-alpha 4] | 7,985 | 8.46% | 7,510 | 8.06% | 6,510 | 7.06% | ||||||||
| Latin American | 2,290 | 2.43% | 2,195 | 2.36% | 2,200 | 2.39% | ||||||||
| Indigenous | 555 | 0.59% | 660 | 0.71% | 735 | 0.8% | ||||||||
| Other/multiracial[lower-alpha 5] | 3,695 | 3.92% | 2,760 | 2.96% | 2,225 | 2.41% | ||||||||
| Total responses | 94,335 | 99.26% | 93,170 | 98.51% | 92,205 | 99.14% | ||||||||
| Total population | 95,039 | 100% | 94,579 | 100% | 93,007 | 100% | ||||||||
| Notes: Totals greater than 100% due to multiple origin responses. Demographics based on 2012 Canadian federal electoral redistribution riding boundaries. | ||||||||||||||
Members of Parliament
This riding has elected the following Members of Parliament:
| Parliament | Years | Member | Party | |
|---|---|---|---|---|
| Don Valley East Riding created from Willowdale, York East, York North and York—Scarborough |
||||
| 31st | 1979–1980 | Sam Wakim | Progressive Conservative | |
| 32nd | 1980–1984 | David Smith | Liberal | |
| 33rd | 1984–1988 | Bill Attewell | Progressive Conservative | |
| 34th | 1988–1993 | Alan Redway | ||
| 35th | 1993–1997 | David Collenette | Liberal | |
| 36th | 1997–2000 | |||
| 37th | 2000–2004 | |||
| 38th | 2004–2006 | Yasmin Ratansi | ||
| 39th | 2006–2008 | |||
| 40th | 2008–2011 | |||
| 41st | 2011–2015 | Joe Daniel | Conservative | |
| 42nd | 2015–2019 | Yasmin Ratansi | Liberal | |
| 43rd | 2019–2020 | |||
| 2020–2021 | Independent | |||
| 44th | 2021–present | Michael Coteau | Liberal | |
Election results
| 2021 Canadian federal election | ||||||||
|---|---|---|---|---|---|---|---|---|
| Party | Candidate | Votes | % | ±% | Expenditures | |||
| Liberal | Michael Coteau | 22,356 | 59.90 | +0.09 | $90,078.21 | |||
| Conservative | Penelope Williams | 8,766 | 23.49 | –0.43 | $39,800.25 | |||
| New Democratic | Simon Topp | 4,618 | 12.37 | +1.38 | $10,191.25 | |||
| People's | Peter De Marco | 1,585 | 4.25 | +2.92 | none listed | |||
| Total valid votes/expense limit | 37,325 | 100.00 | – | $104,140.64 | ||||
| Total rejected ballots | 470 | 1.24 | +0.22 | |||||
| Turnout | 37,795 | 59.12 | –5.11 | |||||
| Eligible voters | 63,934 | |||||||
| Liberal hold | Swing | +0.26 | ||||||
| Source: Elections Canada[9] | ||||||||
| 2019 Canadian federal election | ||||||||
|---|---|---|---|---|---|---|---|---|
| Party | Candidate | Votes | % | ±% | Expenditures | |||
| Liberal | Yasmin Ratansi | 25,295 | 59.81 | +1.98 | $74,656.45 | |||
| Conservative | Michael Ma | 10,115 | 23.92 | -5.31 | $66,318.23 | |||
| New Democratic | Nicholas Thompson | 4,647 | 10.99 | +0.63 | none listed | |||
| Green | Dan Turcotte | 1,675 | 3.96 | +1.37 | $3,743.20 | |||
| People's | John P. Hendry | 562 | 1.33 | - | none listed | |||
| Total valid votes/expense limit | 42,294 | 99.98 | ||||||
| Total rejected ballots | 438 | 1.02 | +0.41 | |||||
| Turnout | 42,732 | 64.23 | -1.31 | |||||
| Eligible voters | 66,530 | |||||||
| Liberal hold | Swing | +3.65 | ||||||
| Source: Elections Canada[10][11] | ||||||||
| 2015 Canadian federal election | ||||||||
|---|---|---|---|---|---|---|---|---|
| Party | Candidate | Votes | % | ±% | Expenditures | |||
| Liberal | Yasmin Ratansi | 24,048 | 57.82 | +19.43 | $109,579.16 | |||
| Conservative | Maureen Harquail | 12,155 | 29.23 | -7.16 | $127,111.51 | |||
| New Democratic | Khalid Ahmed | 4,307 | 10.36 | -11.52 | $9,377.74 | |||
| Green | Laura Elizabeth Sanderson | 1,078 | 2.59 | -0.21 | – | |||
| Total valid votes/expense limit | 41,588 | 99.39 | $197,799.11 | |||||
| Total rejected ballots | 257 | 0.61 | ||||||
| Turnout | 41,845 | 65.54 | ||||||
| Eligible voters | 63,845 | |||||||
| Liberal gain from Conservative | Swing | +13.30 | ||||||
| Source: Elections Canada[12][13][14] | ||||||||
| 2011 federal election redistributed results[15] | |||
|---|---|---|---|
| Party | Vote | % | |
| Liberal | 13,503 | 38.39 | |
| Conservative | 12,794 | 36.38 | |
| New Democratic | 7,694 | 21.88 | |
| Green | 994 | 2.83 | |
| Others | 187 | 0.53 | |
2003 boundaries
| 2011 Canadian federal election | ||||||||
|---|---|---|---|---|---|---|---|---|
| Party | Candidate | Votes | % | ±% | Expenditures | |||
| Conservative | Joe Daniel | 14,422 | 36.78 | +5.78 | ||||
| Liberal | Yasmin Ratansi | 13,552 | 34.56 | -13.51 | ||||
| New Democratic | Mary Trapani Hynes | 9,878 | 25.19 | +11.87 | ||||
| Green | Akil Sadikali | 1,114 | 2.84 | -4.05 | ||||
| Christian Heritage | Ryan Kidd | 246 | 0.63 | -0.07 | ||||
| Total valid votes | 39,212 | 100.00 | ||||||
| Total rejected ballots | 218 | 0.55 | – | |||||
| Turnout | 39,430 | 57.24 | – | |||||
| Eligible voters | 68,890 | – | – | |||||
| 2008 Canadian federal election | ||||||||
|---|---|---|---|---|---|---|---|---|
| Party | Candidate | Votes | % | ±% | Expenditures | |||
| Liberal | Yasmin Ratansi | 18,264 | 48.07 | -5.92 | $67,602 | |||
| Conservative | Eugene McDermott | 11,777 | 31.00 | +1.84 | $77,618 | |||
| New Democratic | Mary Trapani Hynes | 5,062 | 13.32 | +0.43 | $5,282 | |||
| Green | Wayne Clements | 2,618 | 6.89 | +2.95 | $4,032 | |||
| Christian Heritage | Alex Kovalenko | 266 | 0.70 | – | $163 | |||
| Total valid votes/expense limit | 37,987 | 100.00 | $81,387 | |||||
| Liberal hold | Swing | -3.88 | ||||||
| 2006 Canadian federal election | ||||||||
|---|---|---|---|---|---|---|---|---|
| Party | Candidate | Votes | % | ±% | ||||
| Liberal | Yasmin Ratansi | 23,441 | 53.99 | -0.6 | ||||
| Conservative | Eugene McDermott | 12,661 | 29.16 | +1.2 | ||||
| New Democratic | Richard Alan Hennick | 5,597 | 12.89 | -0.3 | ||||
| Green | Wayne Clements | 1,714 | 3.94 | +1.0 | ||||
| Total valid votes | 43,413 | 100.00 | ||||||
| 2004 Canadian federal election | ||||||||
|---|---|---|---|---|---|---|---|---|
| Party | Candidate | Votes | % | ±% | ||||
| Liberal | Yasmin Ratansi | 21,864 | 54.6 | -12.0 | ||||
| Conservative | David Johnson | 11,206 | 28.0 | +7.7 | ||||
| New Democratic | Valerie Ann Mah | 5,287 | 13.2 | +7.4 | ||||
| Green | Dan King | 1,172 | 2.9 | |||||
| Christian Heritage | Ryan Kidd | 351 | 0.8 | +0.3 | ||||
| Communist | Christopher Black | 149 | 0.4 | |||||
| Total valid votes | 40,029 | 100.0 | ||||||
Note: Conservative vote is compared to the total of the Canadian Alliance vote and Progressive Conservative vote in 2000 election.
1996 boundaries
| 2000 Canadian federal election: Don Valley East | ||||||||
|---|---|---|---|---|---|---|---|---|
| Party | Candidate | Votes | % | ±% | ||||
| Liberal | David Collenette | 25,915 | 66.6 | +11.5 | ||||
| Progressive Conservative | Cecila Fusco | 5,645 | 14.5 | -7.6 | ||||
| Alliance | Kasra Nejatian | 4,736 | 12.2 | -1.1 | ||||
| New Democratic | Ron Casey Nestor | 2,249 | 5.8 | -1.9 | ||||
| Independent | Ryan Kidd | 212 | 0.5 | |||||
| Marxist–Leninist | Judith Snow | 153 | 0.4 | |||||
| Total valid votes | 38,910 | 100.0 | ||||||
Note: Canadian Alliance vote is compared to the Reform vote in 1997 election.
| 1997 Canadian federal election: Don Valley East | ||||||||
|---|---|---|---|---|---|---|---|---|
| Party | Candidate | Votes | % | ±% | ||||
| Liberal | David Collenette | 21,511 | 55.1 | +1.0 | ||||
| Progressive Conservative | Denzil Minnan-Wong | 8,610 | 22.1 | -1.3 | ||||
| Reform | John Pope | 5,167 | 13.2 | -4.1 | ||||
| New Democratic | Shodja Ziaian | 2,981 | 7.6 | +3.8 | ||||
| Canadian Action | Joe Braini | 384 | 1.0 | |||||
| Natural Law | Mark Roy | 192 | 0.5 | 0.0 | ||||
| Independent | Mariam Abou-Dib | 170 | 0.4 | |||||
| Total valid votes | 39,015 | 100.0 | ||||||
1987 boundaries
| 1993 Canadian federal election: Don Valley East | ||||||||
|---|---|---|---|---|---|---|---|---|
| Party | Candidate | Votes | % | ±% | ||||
| Liberal | David Collenette | 21,511 | 54.1 | +16.2 | ||||
| Progressive Conservative | Alan Redway | 9,279 | 23.3 | -21.4 | ||||
| Reform | Gordon E. Honsey | 6,877 | 17.3 | |||||
| New Democratic | Janice Waud Loper | 1,538 | 3.9 | -11.2 | ||||
| Libertarian | Mark Meschino | 238 | 0.6 | -0.7 | ||||
| Natural Law | Fred Fredeen | 205 | 0.5 | |||||
| Marxist–Leninist | Roger Carter | 90 | 0.2 | |||||
| Abolitionist | Michael Mazerolle | 22 | 0.1 | |||||
| Total valid votes | 39,760 | 100.0 | ||||||
| 1988 Canadian federal election: Don Valley East | ||||||||
|---|---|---|---|---|---|---|---|---|
| Party | Candidate | Votes | % | ±% | ||||
| Progressive Conservative | Alan Redway | 18,719 | 44.7 | -9.7 | ||||
| Liberal | Yasmin Ratansi | 15,881 | 37.9 | +3.9 | ||||
| New Democratic | Brant Loper | 6,310 | 15.1 | +4.4 | ||||
| Libertarian | Mark Meschino | 538 | 1.3 | +0.6 | ||||
| Independent | David Smith | 271 | 0.6 | |||||
| Communist | Maria Kontopidis | 155 | 0.4 | |||||
| Total valid votes | 41,874 | 100.0 | ||||||
1976 boundaries
| 1984 Canadian federal election: Don Valley East | ||||||||
|---|---|---|---|---|---|---|---|---|
| Party | Candidate | Votes | % | ±% | ||||
| Progressive Conservative | Bill Attewell | 29,706 | 54.4 | +11.4 | ||||
| Liberal | David Smith | 18,578 | 34.0 | -10.6 | ||||
| New Democratic | Joe Macdonald | 5,842 | 10.7 | -0.9 | ||||
| Libertarian | Robert Champlain | 356 | 0.7 | +0.1 | ||||
| Independent | Arthur V. Wright | 162 | 0.3 | +0.1 | ||||
| Total valid votes | 54,644 | 100.0 | ||||||
| 1980 Canadian federal election: Don Valley East | ||||||||
|---|---|---|---|---|---|---|---|---|
| Party | Candidate | Votes | % | ±% | ||||
| Liberal | David Smith | 21,944 | 44.6 | +4.8 | ||||
| Progressive Conservative | Sam Wakim | 21,119 | 43.0 | -4.2 | ||||
| New Democratic | Saul Paton | 5,713 | 11.6 | -0.7 | ||||
| Libertarian | Gordon Keys | 286 | 0.6 | 0.0 | ||||
| Independent | Arthur V. Wright | 98 | 0.2 | |||||
| Total valid votes | 49,160 | 100.0 | ||||||
| 1979 Canadian federal election: Don Valley East | ||||||||
|---|---|---|---|---|---|---|---|---|
| Party | Candidate | Votes | % | |||||
| Progressive Conservative | Sam Wakim | 25,352 | 47.2 | |||||
| Liberal | Mike Smith | 21,428 | 39.9 | |||||
| New Democratic | Saul Paton | 6,595 | 12.3 | |||||
| Libertarian | Nick Moldovanyi | 301 | 0.6 | |||||
| Marxist–Leninist | Donna Gordon | 56 | 0.1 | |||||
| Total valid votes | 53,732 | 100.0 | ||||||
See also
References
- "Don Valley East (federal electoral district) (Code 35016) Census Profile". 2011 census. Government of Canada - Statistics Canada. Retrieved March 2, 2012.
- Federal riding history from the Library of Parliament
- 2011 Results from Elections Canada
- Campaign expense data from Elections Canada
Notes
- ↑ Statistic includes all persons that did not make up part of a visible minority or an indigenous identity.
- ↑ Statistic includes total responses of "Chinese", "Korean", and "Japanese" under visible minority section on census.
- ↑ Statistic includes total responses of "West Asian" and "Arab" under visible minority section on census.
- ↑ Statistic includes total responses of "Filipino" and "Southeast Asian" under visible minority section on census.
- ↑ Statistic includes total responses of "Visible minority, n.i.e." and "Multiple visible minorities" under visible minority section on census.
- ↑ "Census Profile, 2021 Census". Statistics Canada. 2022. Retrieved February 9, 2022.
- ↑ Statistics Canada
- ↑ CBC News, "Conservatives deny party focus of robocalls probe", Laura Payton, April 17, 2012
- ↑ CBC News, "6 ridings remain in Federal Court election challenge", Laura Payton, Oct 23, 2012
- ↑ Government of Canada, Statistics Canada (February 9, 2022). "Profile table, Census Profile, 2021 Census of Population - Don Valley East [Federal electoral district (2013 Representation Order)], Ontario". www12.statcan.gc.ca. Retrieved March 5, 2023.
- ↑ Government of Canada, Statistics Canada (October 26, 2022). "Census Profile, 2021 Census of Population". www12.statcan.gc.ca. Retrieved January 6, 2024.
- ↑ Government of Canada, Statistics Canada (October 27, 2021). "Census Profile, 2016 Census". www12.statcan.gc.ca. Retrieved January 6, 2024.
- ↑ Government of Canada, Statistics Canada (November 27, 2015). "NHS Profile". www12.statcan.gc.ca. Retrieved January 6, 2024.
- ↑ "September 20, 2021 General Election Results Validated by the Returning Officer". Elections Canada. Retrieved October 14, 2021.
- ↑ "List of confirmed candidates". Elections Canada. Retrieved October 3, 2019.
- ↑ "Official Voting Results -". Elections Canada. Retrieved August 8, 2021.
- ↑ Elections Canada – Confirmed candidates for Don Valley East, 30 September 2015
- ↑ Elections Canada – Final Candidates Election Expenses Limits
- ↑ Elections Canada – Forty-Second General Election 2015 - Poll-by-poll results
- ↑ Pundits' Guide to Canadian Elections