Restauración | |
|---|---|
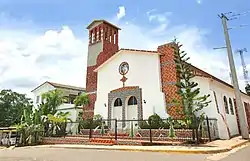
 Church in town of Restauracion, Dajabon province, Dominican Republic. | |
 Seal | |
 Restauración | |
| Coordinates: 19°18′N 71°41′W / 19.300°N 71.683°W | |
| Country | Dominican Republic |
| Province | Dajabón |
| Municipality since | 1907 |
| Area | |
| • Total | 283.58 km2 (109.49 sq mi) |
| Elevation | 594 m (1,949 ft) |
| Population (2012)[3] | |
| • Total | 6,948 |
| • Density | 25/km2 (63/sq mi) |
| Municipalities | 0 |
| Climate | Am |
Restauración is the third largest city in the province of Dajabon, Dominican Republic. It is located in the northwest portion of the island, in the Cibao region.
History
The city's foundation dates back to 1882, when the officers Sotero Blanc, Pablo Reyes and Eusebio Gómez expelled the Haitian military that was established in the area, and raised the Dominican flag, thus recovering this territory. A year later, General Sotero Blanc suggested to the then president Ulises Heureaux, to baptize the place with the name of Cantonal Restoration Post.
From that moment on, the new canton was named like this, jurisdiction at that time of the province of Monte Cristi, second capital of the nation at that time.
On June 23, 1892, through decree No. 31/92 of President Ulises Heureaux, Restauración is elevated to the category of Common [Municipality].
Restauración was the first municipality in the province of Dajabón, created in 1938 through Law 1521 of June 20 of that year.
Climate
| Climate data for Restauración (1961–1990) | |||||||||||||
|---|---|---|---|---|---|---|---|---|---|---|---|---|---|
| Month | Jan | Feb | Mar | Apr | May | Jun | Jul | Aug | Sep | Oct | Nov | Dec | Year |
| Record high °C (°F) | 36.5 (97.7) |
37.5 (99.5) |
39.9 (103.8) |
37.0 (98.6) |
38.8 (101.8) |
38.8 (101.8) |
38.8 (101.8) |
39.5 (103.1) |
38.8 (101.8) |
38.5 (101.3) |
37.5 (99.5) |
36.8 (98.2) |
39.9 (103.8) |
| Mean daily maximum °C (°F) | 29.6 (85.3) |
30.0 (86.0) |
31.2 (88.2) |
31.4 (88.5) |
31.7 (89.1) |
31.8 (89.2) |
32.4 (90.3) |
32.3 (90.1) |
31.9 (89.4) |
31.7 (89.1) |
30.4 (86.7) |
29.1 (84.4) |
31.1 (88.0) |
| Mean daily minimum °C (°F) | 16.0 (60.8) |
16.0 (60.8) |
16.5 (61.7) |
17.4 (63.3) |
18.3 (64.9) |
18.9 (66.0) |
18.7 (65.7) |
18.8 (65.8) |
18.8 (65.8) |
18.8 (65.8) |
18.2 (64.8) |
16.8 (62.2) |
17.8 (64.0) |
| Record low °C (°F) | 7.2 (45.0) |
8.8 (47.8) |
9.0 (48.2) |
8.0 (46.4) |
11.0 (51.8) |
13.0 (55.4) |
11.0 (51.8) |
14.9 (58.8) |
12.3 (54.1) |
15.0 (59.0) |
11.9 (53.4) |
9.0 (48.2) |
7.2 (45.0) |
| Average rainfall mm (inches) | 45.8 (1.80) |
45.3 (1.78) |
64.5 (2.54) |
102.6 (4.04) |
177.3 (6.98) |
179.9 (7.08) |
129.3 (5.09) |
160.3 (6.31) |
220.2 (8.67) |
213.6 (8.41) |
94.9 (3.74) |
56.1 (2.21) |
1,489.8 (58.65) |
| Average rainy days (≥ 1.0 mm) | 4.0 | 3.9 | 4.7 | 6.7 | 12.0 | 12.3 | 9.7 | 11.7 | 13.1 | 12.6 | 7.1 | 4.2 | 102.0 |
| Source: NOAA[4] | |||||||||||||
References
- ↑ Superficies a nivel de municipios, Oficina Nacional de Estadistica Archived 2009-04-17 at the Wayback Machine
- ↑ De la Fuente, Santiago (1976). Geografía Dominicana (in Spanish). Santo Domingo, Dominican Republic: Editora Colegial Quisqueyana.
- ↑ Censo 2012 de Población y Vivienda, Oficina Nacional de Estadistica
- ↑ "Restauracion Climate Normals 1961-1990". National Oceanic and Atmospheric Administration. Retrieved September 19, 2016.
Sources
- World Gazeteer: Dominican Republic at archive.today (archived 2012-12-04) – World-Gazetteer.com