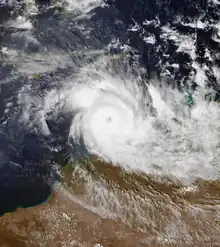
| Tropical cyclones in 1998 | |
|---|---|
| Year boundaries | |
| First system | Ron and Katrina |
| Formed | January 1, 1998 |
| Last system | TL |
| Dissipated | January 2, 1999 |
| Strongest system | |
| Name | Zeb, Ron and Susan |
| Lowest pressure | 900 mbar (hPa); 26.58 inHg |
| Longest lasting system | |
| Name | Katrina (Fourth longest-lasting tropical system on record) |
| Duration | 24 days |
| Year statistics | |
| Total systems | 125 |
| Named systems | 73 |
| Total fatalities | > 23,365 |
| Total damage | $29.802 billion (1998 USD) |

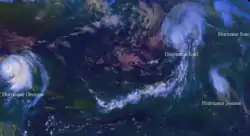
During 1998, tropical cyclones formed within seven different tropical cyclone basins, located within various parts of the Atlantic, Pacific, and Indian Oceans. A total of 125 tropical cyclones formed, with 72 of them being named by various weather agencies when they attained maximum sustained winds of 35 knots (65 km/h, 40 mph). The strongest tropical cyclones were Zeb, Ron and Susan which peaked with a pressure of 900 hPa (26.58 inHg). Hurricane Mitch of late October was the deadliest tropical cyclone, killing 11,000 people as it catastrophically affected Central America, and Mexico as a Category 5 major hurricane. Meanwhile, Georges became the costliest, with the damages amounting to $9.37 billion, which also became the costliest in the history of the Dominican Republic and the country of Saint Kitts and Nevis. Throughout the year, four Category 5 tropical cyclones formed. The accumulated cyclone energy (ACE) index for the 1998 (seven basins combined), as calculated by Colorado State University was 773.1 units.
Global atmospheric and hydrological conditions
A strong La Niña started in 1998 and persisted until early 2001.[1]
Summary

North Atlantic Ocean

An average Atlantic hurricane season features 12 tropical storms, 6 hurricanes, and 3 major hurricanes, and features an Accumulated Cyclone Energy (ACE) count of 106. In 2020 in the North Atlantic basin, all of the statistics fell well above listed, featuring a record-breaking 30 tropical storms, 13 hurricanes, and 6 major hurricanes, with an ACE total of 178.
The 1998 Atlantic hurricane season was one of the most disastrous Atlantic hurricane seasons on record, featuring the highest number of storm-related fatalities in over 218 years and one of the costliest ever at the time.[2] The season had above average activity, due to the dissipation of the El Niño event and transition to La Niña conditions.
The most notable storms were Hurricane Georges and Hurricane Mitch. Georges devastated Saint Kitts and Nevis, Puerto Rico and the Dominican Republic as a major Category 3 storm but peaked as a high-end Category 4 hurricane just before moving through many of the Caribbean Islands before affecting the southern US mainland, making its landfall near Biloxi, Mississippi, causing significant damage and at least 600 confirmed deaths while Mitch, the strongest storm of the season, was a very powerful and destructive late-season Category 5 hurricane that affected much of Central America before making landfall in Florida as a tropical storm. The significant amount of rainfall that Mitch produced across Central America caused significant damage and killed at least 11,000 people, making the system the second deadliest Atlantic hurricane in recorded history, behind only the Great Hurricane of 1780. Mitch, was later tied with 2007's Hurricane Dean for the eighth-most intense Atlantic hurricane ever recorded.
Hurricanes Georges and Mitch caused $9.37 billion in damage and $6.08 billion (1998 USD)[nb 1] in damage, respectively and the 1998 Atlantic hurricane season was at the time, the second-costliest season ever, after the 1992 season. However, it is now the eleventh costliest season as it was surpassed by the 2005 Atlantic hurricane season.
Eastern and central Pacific Ocean

An average Pacific hurricane season features 15 tropical storms, 9 hurricanes, and 4 major hurricanes, and features an Accumulated Cyclone Energy (ACE) count of 132.
The season produced 13 named storms, slightly below the average of 15 named storms per season. However, the season total of nine hurricanes was one above the average, and the total of six major hurricanes surpassed the average of three.[3] Activity during the season was hindered by the northward movement of the Intertropical Convergence Zone (ITCZ). The ITCZ, which is normally situated south of the Gulf of Tehuantepec, shifted northward into Central and Southern Mexico, making the cyclone closer to cooler sea surface temperatures, hence limiting the number of storms that formed during the season. Although a semi-permanent anticyclone persisted through the summer of 1998, causing most of the storms to remain at sea, some storm did threaten the Baja California Peninsula due to a weakness in the anticyclone. Except for Hurricane Kay, all of the storms of the season originated from tropical waves.[4]
Western Pacific Ocean

The average typhoon season lasts year-round, with the majority of the storms forming between May and October. An average Pacific typhoon season features 26 tropical storms, 16 typhoons, and 9 super typhoons (unofficial category). It also features an average Accumulated Cyclone Energy (ACE) count of approximately 294; the basin is typically the most active basin for tropical cyclone formation.
During the 1998 Pacific typhoon season, a total of 28 tropical depressions developed across the western Pacific basin. Of those 28 depressions, a total of 18 strengthened into tropical storms of which 9 further intensified into typhoons. The first tropical cyclone developed on May 28, marking the fourth latest start to any Pacific typhoon season on record, and the last one dissipated on December 22. The Philippine region also set a record: with only eleven storms forming or moving into its area of responsibility, PAGASA had its quietest season as of 2006.[5] Overall inactivity was caused by an unusually strong La Niña, which also fueled a hyperactive Atlantic hurricane season that year.
North Indian Ocean

With eleven depressions and eight tropical cyclones, this was one of the most active seasons in the ocean along with 1987, 1996, and 2005.[6] The season caused a large loss of life, most of which was from one storm. Over 10,000 people were killed in India when Tropical Cyclone 03A brought a 4.9-metre (16 ft) storm surge to the Kathiawar Peninsula, inundating numerous salt mines. Total damages from the storm amounted to Rs. 120 billion (US$3 billion). Tropical Cyclone 01B killed at least 26 people and left at least 4,000 fishermen missing in eastern Bangladesh on May 20. A short lived depression in mid-October killed 122 people after triggering severe flooding in Andhra Pradesh. In November, Tropical Cyclone 06B killed six people and caused property damage worth BTN 880 million (US$20.7 million) in eastern India. An additional 40 people were killed and 100 fishermen were listed as missing after Tropical Cyclone 07B affected Bangladesh.
South-West Indian Ocean


January–June
The 1997–98 South-West Indian Ocean cyclone season was fairly quiet and had the latest start in 30 years. The first tropical disturbance originated on January 16, although the first named storm, Anacelle, was not upgraded until February 8, a record late start. The last storm to dissipate was an unusually late tropical depression in late July. Many of the storms suffered from the effects of wind shear, which contributed to there being only one tropical cyclone – equivalent to a minimal hurricane. The season also occurred during a powerful El Niño.
Tropical Depression A1, the first of the season, moved throughout most of Mozambique in January, causing landslides and flooding. One landslide affected Milange District, where many houses were swept into a river. Landslides killed between 87 and 143 people in the country. In February, Cyclone Anacelle buffeted several islands with gusty winds after becoming the strongest storm of the season, reaching maximum sustained winds of 140 km/h (85 mph). Although Anacelle was the first named storm of the season, another tropical depression preceded it that crossed Madagascar several times. The depression eventually became Tropical Storm Beltane, and lasted 17 days. Beltane caused flooding across Madagascar due to heavy rainfall, which killed one person and left locally heavy crop damage. There were several other disturbances in February, including Cindy which dissipated 50 days after it originated, as well as a disturbance that brought heavy rainfall to Réunion and Mauritius. The rest of the season was fairly quiet, mostly with short-lived tropical disturbances or storms.
July–December
The first system of the season proper originated out of an area of convection in early September in the northeast portion of the basin. On September 3, the MFR initiated advisories on Tropical Disturbance A1 about 1435 km (890 mi) east of Diego Garcia. The system tracked westward, and the JTWC issued a Tropical Cyclone Formation Alert (TCFA) on September 4. Failing to intensify beyond winds of 45 km/h (30 mph), the disturbance dissipated on September 6. Later in the month, Tropical Disturbance A2 formed in a similar region within the monsoon trough, with the MFR initiating advisories on September 29. Also on that day, the JTWC began issuing advisories on Tropical Cyclone 02S.[7] That day, the JTWC upgraded the system to tropical storm status,[8] although strong wind shear prevented intensification. The MFR quickly discontinued advisories, but the JTWC continued tracking it, again upgrading the system to tropical storm status on October 1. After the shear again increased, the storm weakened, dissipating on October 2.
In November, rapidly weakening Tropical Cyclone Alison moved from the Australian basin and dissipated immediately upon entering the south-west Indian Ocean on November 13.[9] On December 4, short-lived Tropical Disturbance A3 was classified by MFR, subsequently drifting into the Australian region.[10] Possibly related to the previous system, Tropical Cyclone Cathy moved from the Australian basin into the basin on December 28, quickly dissipating.[10][11]
Australian Region
January–June
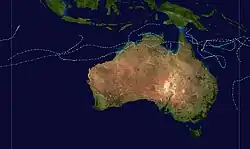
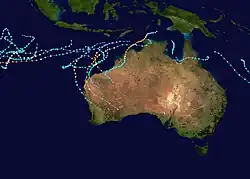
The 1997–98 Australian region cyclone season was a slightly below-average tropical cyclone season. Cyclone Katrina formed on January 1, which erratically moved around Australia in its lifetime. Tiffany and Les also formed in January, affecting Western Australia and Northern Territory, with the latter causing 3 deaths. Cyclone Victor formed from a tropical low that was the remnant low of Cyclone Katrina, before renaming Cindy as it crossed to the South-West Indian Ocean basin. A tropical low also crossed to the same basin, which strengthened to Tropical Cyclone Elsie before weakening. Nathan also formed in March, peaking as a Category 2 cyclone before dissipating on March 26. The post-tropical cyclone that was former Yali in the South Pacific crossed the region before re-exiting the basin towards New Zealand. The last tropical low of the season dissipated on April 19 as it brought downpour to the Western Australia.
July–December
On 7 October, a tropical low near the Cocos (Keeling) Islands strengthened to Tropical Cyclone Zelia, while becoming the first storm of the season. It weakened due to wind shear and dissipated on 10 October. A month later, Alison developed over the open waters near Western Australia, peaking as a severe tropical cyclone before passing near Cocos Islands, bringing gale-force winds before dissipating on 13 November, shortly before crossing to the South-West Indian Ocean basin. Billy and Thelma both affected Western Australia and Northern Territory both as severe tropical cyclones, with the latter causing a death, ten months after the cyclone's passage. A disturbance crossed to the basin, before degenerating afterwards. Cathy was believed to be the remnant low of the former disturbance. Peaking as a Category 2 cyclone, it exited the basin on 28 December before dissipating immediately. The last disturbance formed near Brisbane before dissipating on 2 January.
South Pacific Ocean


January–June
The 1997–98 season was one of the most active and longest South Pacific tropical cyclone seasons on record, with 16 tropical cyclones occurring within the South Pacific basin between 160°E and 120°W.[12] The season was characterised by a very strong El Niño event, which caused the South Pacific convergence zone, to move from its usual position near the Solomon Islands to the Northern Cook Islands. As a result, ten tropical cyclones formed to the east of the International Date Line, with seven of these tropical cyclones going on to affect French Polynesia.
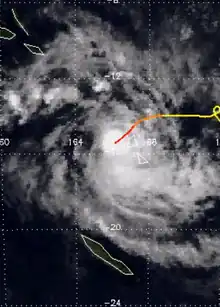
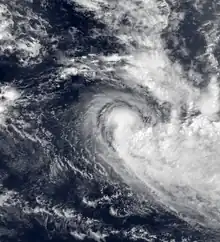
Severe Tropical Cyclones Ron and Susan were both the strongest tropical cyclones of the season and were thought to be the strongest tropical cyclones in the region since Severe Tropical Cyclone Hina of the 1984–85 season.
After the final warnings on Cyclone Tui were issued a weak circulation remained in the vicinity of Samoa for several days, before a westerly surge from the monsoon resulted in a tropical cyclone developing during February 1. However, due to uncertainties in the continuation of Tui after several other weak low-pressure areas had formed, the FMS decided to treat the cyclone as a separate system and named it Wes.[13]
Tropical Cyclone Bart developed during the final days of the season and caused ten deaths and minor damage to French Polynesia, before it dissipated during May 3. The names Katrina, Martin, Nute, Osea, Ron, Susan, Tui, Ursula and Veli, were subsequently retired from the lists of names for the region.[14]
July–December
The 1998–99 South Pacific cyclone season was a near-average South Pacific tropical cyclone season, with 8 tropical cyclones occurring within the South Pacific Ocean basin between 160°E and 120°W. Despite the season starting on November 1, the first tropical system of the season did not form until December 1, while the final disturbance of the season dissipated on May 27, 1999. During the season the most intense tropical cyclone was Severe Tropical Cyclone Cora, which had a minimum pressure of 930 hPa (27.46 inHg). After the season had ended the names Cora along with Dani in 1999 were retired from the naming lists, after they had caused significant impacts on South Pacific islands.
The first, Tropical Disturbance 01F, developed about 540 km (340 mi) to the northwest of Apia in American Samoa, however, the system remained weak and was last noted later that day. On December 11, the JTWC started to monitor an area of disturbed weather that had developed within a trough of low pressure, about 670 km (415 mi) to the northeast of Honiara in the Solomon Islands. The depression turned to the south and accelerated as it began to lose tropical characteristics. It passed about 210 nmi west of Norfolk Island and had become extratropical about 400 nmi west-northwest of New Zealand's North Cape on December 17. 02F and Cora followed suit, with the latter affecting Fiji and Tonga. On December 25, Tropical Disturbance 04F developed over the Coral Sea within an area of strong vertical wind shear in the Australian region. During that day 04F moved towards the southeast and entered the South Pacific basin, before dissipating on December 26.
Mediterranean Sea
A medicane was observed from 25 to 27 January.
Systems
January
The month of January was relatively active, with 9 tropical cyclones forming, with 8 of them are being named.
| Storm name | Dates active | Max wind km/h (mph) | Min pressure (hPa) | Areas affected | Damage (USD) | Deaths | Refs |
|---|---|---|---|---|---|---|---|
| Ron | January 1–9 | 230 (145) | 900 | Samoan Islands, Tonga, Wallis and Futuna | $566 thousand | None | |
| Katrina | January 1–25 | 165 (105) | 940 | Solomon Islands, Vanuatu, Far North Queensland | $8.66 million | 2 | [15] |
| A1 | January 16–23 | 60 (35) | 995 | Mozambique, Comoros, Malawi, Europa Island | Unknown | ≥ 87 | [16] |
| Les | January 19 – February 1 | 110 (70) | 976 | Queensland, Northern Territory, Western Australia | $64.7 million | 3 | [17] |
| Tiffany | January 22 – February 2 | 170 (105) | 940 | Western Australia | None | None | |
| Tui | January 25–27 | 75 (45) | 990 | Samoan Islands | $1 million | 1 | [18] |
| Ursula | January 29 – February 2 | 110 (70) | 975 | French Polynesia | Minor | None | |
| Veli | January 30 – February 3 | 100 (65) | 980 | French Polynesia | Minor | None | |
| Wes | January 31 – February 5 | 95 (60) | 985 | Cook Islands, French Polynesia | Unknown | 10 | [19][20] |
February
Like the previous month, the month of February featured nine storms, of which four are respectively named.
| Storm name | Dates active | Max wind km/h (mph) | Min pressure (hPa) | Areas affected | Damage (USD) | Deaths | Refs |
|---|---|---|---|---|---|---|---|
| Beltane | February 3 – 20 | 65 (40) | 992 | Madagascar, Europa Island, Mozambique | Unknown | 1 | [21] |
| Anacelle | February 6 – 13 | 140 (85) | 950 | St. Brandon, Mauritius | None | None | |
| Victor-Cindy | February 8 – 19 | 120 (75) | 970 | Northern Territory, Western Australia | None | None | |
| Unnamed | February 11 – 15 | 65 (40) | 995 | None | None | None | |
| D1 | February 16 – 19 | Unknown | Not specified | Unknown | None | None | |
| D2 | February 18 – 25 | Unknown | Not specified | Mauritius, Réunion | Unknown | Unknown | |
| May | February 25 – 26 | 75 (45) | 990 | Northern Territory | None | None | |
| Unnamed | February 28 – March 2 | 45 (30) | 997 | None | None | None | |
| Unnamed | February 28 – March 1 | 45 (30) | 998 | None | None | None | |
March
The month of March featured 7 tropical cyclones forming, with 6 of them are being named.
| Storm name | Dates active | Max wind km/h (mph) | Min pressure (hPa) | Areas affected | Damage (USD) | Deaths | Refs |
|---|---|---|---|---|---|---|---|
| Unspecified | March 2–5 | Unknown | Not specified | Unknown | None | None | [22] |
| Donaline | March 4–10 | 75 (45) | 988 | None | None | None | |
| Elsie | March 7–18 | 100 (65) | 975 | None | None | None | |
| Fiona | March 15–20 | 55 (35) | 995 | Mascarene Islands | None | None | |
| Yali | March 18–27 | 130 (80) | 965 | Vanuatu, New Caledonia, New Zealand | Minimal | 1 | [23] |
| Nathan | March 20–26 | 95 (60) | 990 | Far North Queensland, Willis Islands, Papua New Guinea | Unknown | None | |
| Zuman | March 29 – April 5 | 150 (90) | 955 | Vanuatu, New Caledonia, New Zealand | Unknown | Unknown | |
April
6 systems formed in April, with 3 of them are respectively named.
| Storm name | Dates active | Max wind km/h (mph) | Min pressure (hPa) | Areas affected | Damage (USD) | Deaths | Refs |
|---|---|---|---|---|---|---|---|
| Gemma | April 7 – 14 | 85 (50) | 985 | None | None | None | |
| Unnamed (33S) | April 7 | Unknown | Not specified | None | None | None | |
| Alan | April 17 – 26 | 75 (45) | 992 | French Polynesia | Unknown | 10 | [24] |
| Unnamed (34S) | April 19 – 22 | 65 (40) | Not specified | None | None | None | |
| TL | April 19 | 65 (40) | 1002 | Western Australia | None | None | |
| Bart | April 28 – May 3 | 85 (50) | 987 | French Polynesia | Minimal | 10 | [25] |
May
| Storm name | Dates active | Max wind km/h (mph) | Min pressure (hPa) | Areas affected | Damage (USD) | Deaths | Refs |
|---|---|---|---|---|---|---|---|
| BOB 01 | May 17 – 20 | 110 (70) | 972 | India, Bangladesh | Unknown | 35 | [26] |
| TD | May 28 – 29 | Not specified | 1002 | Taiwan, Ryukyu Islands | None | None | |
| ARB 01 (02A) | May 28 – 29 | 45 (30) | 997 | None | None | None | |
June
| Storm name | Dates active | Max wind km/h (mph) | Min pressure (hPa) | Areas affected | Damage (USD) | Deaths | Refs |
|---|---|---|---|---|---|---|---|
| ARB 02 | June 4–10 | 165 (105) | 958 | India, Pakistan | $3 billion | 4,000-10,000 | [27] |
| Agatha | June 11–16 | 100 (65) | 993 | None | None | None | |
| BOB 02 | June 13–15 | 55 (35) | 992 | India | None | None | |
| Two-E | June 19–22 | 55 (35) | 1003 | None | None | None | |
| Blas | June 22–30 | 220 (140) | 943 | None | None | None | [nb 2] |
July
| Storm name | Dates active | Max wind km/h (mph) | Min pressure (hPa) | Areas affected | Damage (USD) | Deaths | Refs |
|---|---|---|---|---|---|---|---|
| 01W (Akang) | July 7–12 | 55 (35) | 1002 | Taiwan | None | None | |
| Nichole | July 8–10 | 60 (40) | 998 | China, Taiwan | Unknown | None | |
| Celia | July 17–21 | 95 (60) | 997 | None | None | None | |
| H4 | July 20–23 | Unknown | Not specified | None | None | None | |
| TD | July 23–25 | Not specified | 1004 | None | None | None | |
| Darby | July 23 – August 1 | 185 (115) | 958 | None | None | None | |
| 03W | July 25 | 55 (35) | 1008 | None | None | None | |
| Alex | July 27 – August 2 | 85 (50) | 1000 | None | None | None | |
| Estelle | July 29 – August 8 | 215 (130) | 948 | Baja California Sur, Hawaii | None | None | |
August
| Storm name | Dates active | Max wind km/h (mph) | Min pressure (hPa) | Areas affected | Damage (USD) | Deaths | Refs |
|---|---|---|---|---|---|---|---|
| Otto (Bising) | August 1–6 | 120 (75) | 970 | Philippines, Taiwan, China | $761 thousand | 5 | |
| Frank | August 6–10 | 75 (45) | 1001 | Baja California Peninsula, Southwestern United States | None | 3 | [29] |
| Penny (Klaring) | August 6–11 | 95 (60) | 985 | Philippines, China | None | 1 | [30] |
| Georgette | August 11–17 | 185 (115) | 960 | None | None | None | |
| One-C | August 16–18 | 55 (35) | 1010 | None | None | None | |
| Bonnie | August 19–30 | 185 (115) | 954 | Leeward Islands, North Carolina, Mid-Atlantic States | $1 billion | 5 | [31][32][33] |
| Howard | August 20–30 | 240 (150) | 932 | None | None | None | |
| Charley | August 21–24 | 110 (70) | 1000 | Texas, Mexico | $50 million | 24 | [34][35][36] |
| TD | August 21–22 | Not specified | 1004 | None | None | None | |
| Rex (Deling) | August 23 – September 6 | 140 (85) | 955 | Japan | Unknown | 13 | [30] |
| Danielle | August 24 – September 3 | 165 (105) | 960 | Eastern Seaboard, Northeastern United States, Canadian Maritimes, British Isles | $50 thousand | None | |
| Earl | August 31 – September 3 | 155 (100) | 985 | Florida, Georgia, Carolinas, Atlantic Canada | $79 million | 3 | [37][38] |
September
| Storm name | Dates active | Max wind km/h (mph) | Min pressure (hPa) | Areas affected | Damage (USD) | Deaths | Refs |
|---|---|---|---|---|---|---|---|
| Isis | September 1–3 | 120 (75) | 988 | Baja California Peninsula, Mexico, Southwestern United States, Northwestern United States | $10 million | 14 | [39][40] |
| 07W | September 1–4 | 55 (35) | 1002 | None | None | None | |
| A1 | September 3–6 | 45 (30) | Not specified | None | None | None | |
| Javier | September 6–14 | 95 (60) | 990 | Mexico | Unknown | None | |
| TD | September 7–8 | Not specified | 1004 | None | None | None | |
| Frances | September 8–13 | 100 (65) | 990 | Texas, Louisiana, Midwestern United States | $500 million | Unknown | [nb 3] |
| Stella | September 11–16 | 110 (70) | 965 | Japan, Mariana Islands | $2.17 million | 3 | [41][42][43][44] |
| 09W | September 13–14 | 55 (35) | 998 | China, Vietnam | None | None | |
| Unnamed | September 13–14 | Not specified | 1007 | None | None | None | |
| Georges | September 15 – October 1 | 250 (155) | 937 | Leeward Islands, Puerto Rico, Dominican Republic, Haiti, Cuba, Florida Keys, Louisiana, Mississippi, Alabama, Florida, Georgia | $9.37 billion | 604 | [45] |
| Todd (Emang) | September 15–20 | 140 (85) | 955 | Ryukyu Islands, Japan, China | $236 thousand | 7 | [46] |
| Hermine | September 17–20 | 75 (45) | 999 | Louisiana, Mississippi, Alabama, Florida, Georgia | $85 thousand | 2 | [nb 4] |
| Vicki | September 17–22 | 140 (85) | 960 | Philippines, Japan | $81.7 million | 108 | [47][48] |
| 12W | September 18–19 | 55 (35) | 1000 | Vietnam | None | None | |
| Waldo | September 19–21 | 85 (50) | 994 | Japan | None | None | |
| Ivan | September 19–27 | 150 (90) | 975 | None | None | None | |
| Jeanne | September 21 – October 1 | 165 (105) | 969 | Cape Verde, Portugal, Spain | None | None | |
| Karl | September 23–28 | 165 (105) | 970 | Bermuda, Azores | None | None | |
| Yanni (Heling) | September 26–30 | 120 (75) | 965 | Philippines, Taiwan, Ryukyu Islands, South Korea, Japan | Unknown | ≥ 50 | [49] |
| A2 | September 29 – October 2 | Unknown | Not specified | None | None | None | |
| ARB 03 | September 30 – October 1 | 45 (30) | 997 | None | None | None | |
October
| Storm name | Dates active | Max wind km/h (mph) | Min pressure (hPa) | Areas affected | Damage (USD) | Deaths | Refs |
|---|---|---|---|---|---|---|---|
| Twelve-E | October 1–3 | 55 (35) | 1003 | None | None | None | |
| 15W | October 2–5 | 55 (35) | 1000 | China, Vietnam | None | None | |
| 16W | October 5–7 | 55 (35) | 1010 | Taiwan, Ryukyu Islands | None | None | |
| Lisa | October 5–9 | 120 (75) | 995 | None | None | None | |
| 17W | October 6–7 | 55 (35) | 1008 | Ryukyu Islands | None | None | |
| Zelia | October 7–10 | 75 (45) | 990 | None | None | None | |
| ARB 04 | October 8–9 | 55 (35) | 998 | None | None | None | |
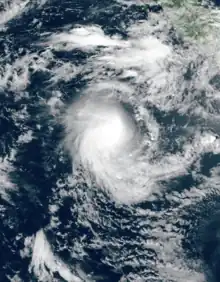
| Zeb (Iliang) | October 9–18 | 205 (125) | 900 | Philippines, Taiwan, Japan | $576 million | 126 | [50] |
| ARB 05 | October 11–17 | 65 (40) | 996 | India | None | None | |
| Alex | October 11 | 45 (30) | 991 | None | None | None | |
| BOB 03 | October 13–14 | 55 (35) | 998 | India | None | None | |
| Kay | October 13–17 | 120 (75) | 987 | None | None | None | |
| Babs (Loleng) | October 14–27 | 155 (100) | 940 | Philippines, Taiwan, China, Japan | $203 million | 327 | [51] |
| Lester | October 15–26 | 185 (115) | 965 | Mexico | Unknown | 2 | [52] |
| Madeline | October 16–20 | 140 (85) | 979 | Mexico, Baja California Peninsula, Texas | $750 million | 32 | [53] |
| Mitch | October 22 – November 5 | 285 (180) | 905 | Central America, Yucatán Peninsula, Florida, Jamaica, Ireland, United Kingdom | $6.08 billion | ≥ 11,374 | [54] |
| BOB 04 | October 28–29 | 55 (35) | 1002 | India | None | None | |
November
| Storm name | Dates active | Max wind km/h (mph) | Min pressure (hPa) | Areas affected | Damage (USD) | Deaths | Refs |
|---|---|---|---|---|---|---|---|
| TD | November 4–7 | Not specified | 1004 | None | None | None | |
| Alison | November 8–13 | 155 (100) | 955 | None | None | None | |
| Chip | November 11–15 | 75 (45) | 994 | Vietnam | $923 thousand | 17 | [55] |
| BOB 05 | November 13–16 | 145 (90) | 982 | India | $20.7 million | 6 | [56] |
| BOB 06 | November 17–23 | 120 (75) | 984 | India, Bangladesh | Unknown | 100+ | [57] |
| Dawn | November 18–20 | 65 (40) | 998 | Vietnam | $28 million | 187 | [58] |
| Elvis (Miding) | November 22–26 | 75 (45) | 992 | Philippines, Vietnam | $30 million | 49 | [55] |
| Nicole | November 24 – December 1 | 140 (85) | 979 | None | None | None | |
December
| Storm name | Dates active | Max wind km/h (mph) | Min pressure (hPa) | Areas affected | Damage (USD) | Deaths | Refs |
|---|---|---|---|---|---|---|---|
| Billy | December 1–6 | 130 (80) | 965 | Western Australia | Unknown | Unknown | [59] |
| Thelma | December 3–15 | 220 (140) | 920 | Northern Territory, Western Australia, Tiwi Islands | Unknown | 1 | [60] |
| 01F | December 4 | Unknown | Not specified | None | None | None | |
| TL (A3) | December 7–13 | 45 (30) | 1000 | None | None | None | |
| Faith (Norming) | December 8–14 | 120 (75) | 970 | Philippines, Vietnam | $45.9 million | 63 | [61][62] |
| Gil | December 9–13 | 75 (45) | 992 | Thailand, Vietnam | None | None | |
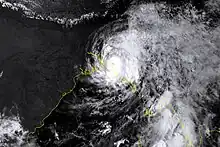
| ARB 06 | December 13–17 | 100 (65) | 993 | Oman | None | 18 | [63] |
| 07P | December 14–17 | 75 (45) | 999 | None | None | None | |
| Cathy | December 16–30 | 110 (70) | 975 | None | None | None | |
| 26W | December 17–19 | 45 (30) | 1002 | Philippines | None | None | |
| 27W | December 19–22 | 55 (35) | 1000 | None | None | None | |
| 02F | December 22–24 | 65 (40) | 997 | None | None | None | |
| Cora | December 21–28 | 140 (85) | 960 | Tonga, Fiji | $12 million | Unknown | |
| 04F | December 25–26 | Unknown | Not specified | None | None | None | |
| TL | December 26 – January 2 | 55 (35) | 996 | Queensland, New South Wales | None | 1 | [64] |
Global effects
There are a total of 9 tropical cyclone basins, 7 are seasonal and two are non-seasonal, thus all 8 basins except the Mediterranean are active. In this table, data from all these basins are added.
See also
Notes
2 Only systems that formed either on or after January 1, 1998 are counted in the seasonal totals.
3 Only systems that formed either before or on December 31, 1998 are counted in the seasonal totals.
4 The wind speeds for this tropical cyclone/basin are based on the IMD Scale which uses 3-minute sustained winds.
5 The wind speeds for this tropical cyclone/basin are based on the Saffir Simpson Scale which uses 1-minute sustained winds.
6The wind speeds for this tropical cyclone are based on Météo-France which uses wind gusts.
- ↑ All damage figures are in 1998 United States dollars, unless otherwise noted
- ↑ The Associated Press attributed 4 deaths from a mudslide in Michoacán to Blas. However, as the primary convection remained offshore, the National Hurricane Center did not consider the deaths related to the hurricane.
- ↑ There were at least 229 deaths, although a government report on the flooding indicated there were over 1000 people killed or missing.
- ↑ Hermine did not directly cause any direct fatalities; however, it may have contributed to two deaths, in Florida and Louisiana.
References
- ↑ "El Niño and La Niña Years and Intensities". ggweather.com.
- ↑ 1998: A "Mean" Season For Atlantic Hurricanes (Report). Silver Springs, Maryland: National Oceanic and Atmospheric Administration. Retrieved August 2, 2013.
- ↑ Blake, Eric S; Gibney, Ethan J; Brown, Daniel P; Mainelli, Michelle; Franklin, James L; Kimberlain, Todd B; Hammer, Gregory R (2009). Tropical Cyclones of the Eastern North Pacific Basin, 1949-2006 (PDF). Archived from the original on July 28, 2013. Retrieved June 14, 2013.
- ↑ Avila, Lixion A.; Guiney, John L. (August 2000). "Eastern North Pacific Hurricane Season of 1998". Monthly Weather Review. 128 (8): 2990–3000. Bibcode:2000MWRv..128.2990A. doi:10.1175/1520-0493(2000)128<2990:ENPHSO>2.0.CO;2. Archived from the original on December 7, 2019. Retrieved June 28, 2019.
- ↑ "Most and least annual average number of tropical cyclone occurrence in the PAR". PAGASA. Archived from the original on 2015-04-13. Retrieved 2012-10-30.
- ↑ National Oceanic and Atmospheric Administration (2009). "Tracks for All Northern Hemisphere Tropical Cyclones". World Meteorological Organization. Retrieved February 9, 2009.
- ↑ Gary Padgett. "Monthly Tropical Cyclone Weather Summary September 1998". Retrieved 2014-01-22.
- ↑ Kenneth R. Knapp; Michael C. Kruk; David H. Levinson; Howard J. Diamond; Charles J. Neumann (2010). 1999 HSK0299 (1998271S05084). The International Best Track Archive for Climate Stewardship (IBTrACS): Unifying tropical cyclone best track data (Report). Bulletin of the American Meteorological Society. Archived from the original on 2014-01-23. Retrieved 2014-01-22.
- ↑ Kenneth R. Knapp; Michael C. Kruk; David H. Levinson; Howard J. Diamond; Charles J. Neumann (2010). 1999 Alison (1998310S10096). The International Best Track Archive for Climate Stewardship (IBTrACS): Unifying tropical cyclone best track data (Report). Bulletin of the American Meteorological Society. Archived from the original on 2016-03-05. Retrieved 2014-01-22.
- 1 2 Gary Padgett. "Monthly Tropical Cyclone Weather Summary December 1998". Retrieved 2014-01-28.
- ↑ Kenneth R. Knapp; Michael C. Kruk; David H. Levinson; Howard J. Diamond; Charles J. Neumann (2010). 1999 Cathy (1998357S11101). The International Best Track Archive for Climate Stewardship (IBTrACS): Unifying tropical cyclone best track data (Report). Bulletin of the American Meteorological Society. Archived from the original on 2016-03-05. Retrieved 2014-01-22.
- ↑ RSMC Nadi — Tropical Cyclone Centre (August 29, 2007). RSMC Nadi Tropical Cyclone Seasonal Summary 1997-98 (PDF) (Report). Fiji Meteorological Service. Archived from the original (PDF) on March 26, 2009. Retrieved May 29, 2011.
- ↑ Padgett, Gary. "Monthly Global Tropical Cyclone Summary February 1998". Archived from the original on February 28, 2014. Retrieved February 22, 2014.
- ↑ RA V Tropical Cyclone Committee (May 5, 2015). Tropical Cyclone Operational Plan for the South-East Indian Ocean and the Southern Pacific Ocean 2014 (PDF) (Report). World Meteorological Organization. pp. 2B-1–2B-4 (23–26). Archived (PDF) from the original on May 18, 2015. Retrieved May 6, 2015.
- ↑ RSMC Nadi — Tropical Cyclone Centre. RSMC Nadi Tropical Cyclone Seasonal Summary 1997-98 (PDF) (Report). Fiji Meteorological Service. Archived from the original (PDF) on 26 March 2009. Retrieved 22 November 2015.
- ↑ "Landslide death toll might hit 143". ReliefWeb. Reuters. 1998-01-29. Retrieved 2014-05-05.
- ↑ Staff Writer (2007). "No Stranger to Floods". Relief in Sight. Archived from the original on 15 June 2007. Retrieved 22 February 2009.
- ↑ "Tropical Cyclone 05P Warning No 1 November 18, 1997 09z". United States Joint Typhoon Warning Center. November 18, 1997. Archived from the original on June 8, 2015. Retrieved October 13, 2019.
- ↑ "Six still missing after landslide kills ten on island". Australian Associated Press. February 8, 1998. – via Lexis Nexis (subscription required)
- ↑ "Landslide on Tahaa, French Polynesia kills at least 10". Radio Australia. February 8, 1998. Archived from the original on August 9, 2014. Retrieved June 28, 2014.
- ↑ Madagascar: Post-Flood Food Security and Cholera Prevention (PDF) (Report). International Federation of Red Cross and Red Crescent Societies. 1998-04-03. Retrieved 2014-05-06.
- ↑ Padgett, Gary (1998). "Monthly Global Tropical Cyclone Summary March 1998". Australian Severe Weather. Archived from the original on September 23, 2015. Retrieved November 28, 2015.
- ↑ March 1998 Southern NZ Ex-tropical Cyclone Yali 1998-03-28 (Report). NZ Historic Weather Events Catalog. Retrieved November 10, 2011.
- ↑ "French Polynesia cyclone deaths rise to 10". Pacific Islands Report. Pacific Islands Development Program/Center for Pacific Islands Studies. May 1, 1998. Archived from the original on February 21, 2014. Retrieved February 9, 2014.
- ↑ May, Jutta (September 17, 2008). "Event Information: Tropical Cyclone Bart". Pacific Disaster.Net. Archived from the original on April 22, 2012. Retrieved June 2, 2011.
- ↑ Nizam Ahmed (May 20, 1998). "Chittagong — Bangladesh storm kills 26, injures more than 100". Reuters. Retrieved May 9, 2009.
- ↑ Staff Writer (December 29, 1998). "1998 Natural Catastrophes: Top 10". Munich Re. Archived from the original on February 10, 2008. Retrieved December 8, 2015.
- ↑ Staff Writer (August 5, 1998). "Taiwan: Typhoon leaves four dead, heads for China". Taipei Central News Agency. Retrieved September 1, 2009.
- ↑ Lixion A. Avila (1998). "Tropical Storm Frank Tropical Cyclone Report". National Hurricane Center. Archived from the original on January 2, 2014. Retrieved February 21, 2007.
- 1 2 Joint Typhoon Warning Center (1999). "1998 Annual Tropical Cyclone Report" (PDF). World Meteorological Organization. Archived from the original (PDF) on June 6, 2011. Retrieved January 21, 2009.
- ↑ Staff Writer (November 13, 1998). "Tropical storm Bonnie heads for Nova Scotia". National Hurricane Center. Retrieved 2008-09-22.
- ↑ Jessica Robertson (August 24, 1998). "Hurricane Bonnie Threatens U.S. Coast -- Two Drown, Dozens Rescued". The Seattle Times. Retrieved 2008-11-06.
- ↑ Lixion A. Avila (October 24, 1998). "Hurricane Bonnie Tropical Cyclone Report". National Hurricane Center. Archived from the original on September 17, 2008. Retrieved September 22, 2008.
- ↑ AVILA/GUINEY/LAWRENCE/MAYFIELD/PASCH/RAPPAPORT (1998). "NHC 1995 Yearly Summary". NHC. Archived from the original on 1998-12-05. Retrieved 2008-03-20.
- ↑ "TPC ATLANTIC CHARLEY 1998 PRELIMINARY REPORT".
- ↑ Edward N. Rappaport (1998). "Tropical Storm Charley Tropical Cyclone Report". NHC. Retrieved 2008-03-19.
- ↑ Max Mayfield (November 17, 1998). "Hurricane Earl Tropical Cyclone Report". National Hurricane Center. Archived from the original on September 2, 2010. Retrieved June 7, 2009.
- ↑ Stuart Hinson (June 7, 1998). "South Carolina Event Report: F2 Tornado". National Climatic Data Center.
- ↑ Richard Pasch (1999). "Hurricane Isis Preliminary Report". National Hurricane Center. Archived from the original on 2006-07-10. Retrieved 2007-02-07.
- ↑ "Hurricane Isis heads toward Mexican mainland". CNN. 3 September 1998. Archived from the original on 2002-09-11. Retrieved 2007-02-08.
- ↑ "Extratropical Storm Stella (9805) Damage report for Sōya Subprefecture" (in Japanese). National Institute of Informatics. 1998. Retrieved March 26, 2010.
- ↑ "Extratropical Storm Stella (9805) Damage report for Obihiro, Hokkaidō" (in Japanese). National Institute of Informatics. 1998. Retrieved March 26, 2010.
- ↑ "Extratropical Storm Stella (9805) Damage report for Iwamizawa, Hokkaidō" (in Japanese). National Institute of Informatics. 1998. Retrieved March 26, 2010.
- ↑ "Extratropical Storm Stella (9805) Damage report for Abashiri Subprefecture" (in Japanese). National Institute of Informatics. 1998. Retrieved March 26, 2010.
- ↑ "Hurricane Georges Preliminary Report". John L. Guiney. 1998. Retrieved February 19, 2021.
- ↑ "Typhoon Todd (9806) Damage report for Kagoshima Prefecture" (in Japanese). National Institute of Informatics. 1998. Retrieved March 26, 2010.
- ↑ "Sulpicio loses court case on Princess of the Orient fatality". ABS-CBN News. 2008-07-03. Retrieved 2020-09-14.
- ↑ "台風第8・7号 平成10年(1998年) 9月20日~9月23日". www.data.jma.go.jp. Retrieved 2020-09-14.
- ↑ Padgett, Gary (26 October 1998). "MONTHLY GLOBAL TROPICAL CYCLONE SUMMARY" (TXT). Typhoon2000. Archived (TXT) from the original on 1 September 2020.
- ↑ Joint Typhoon Warning Center. Super Typhoon Zeb (18W) (PDF) (Report). United States Navy. Archived from the original (PDF) on 2016-03-04. Retrieved 2015-06-01.
- ↑ Joint Typhoon Warning Center. Super Typhoon Babs (20W) (PDF) (Report). United States Navy. Archived from the original (PDF) on 2016-03-04. Retrieved 2015-06-08.
- ↑ Miles Lawrence (1998). "Hurricane Lester Preliminary Report". National Hurricane Center. Retrieved 2007-02-11.
- ↑ Max Mayfield (1998). "Hurricane Madeline Preliminary Report". National Hurricane Center. Retrieved 2008-04-26.
- ↑ John L. Guiney; Miles B. Lawrence (1999-01-28). Hurricane Mitch Preliminary Report (PDF) (Report). National Hurricane Center. Retrieved 2013-05-12.
- 1 2 "MONTHLY GLOBAL TROPICAL CYCLONE SUMMARY". Typhoon2000. November 1998. Archived from the original on 28 January 2021.
- ↑ Joint Typhoon Warning Center (1999). "Tropical Cyclone 06B Preliminary Report" (PDF). World Meteorological Organization. Archived from the original (PDF) on June 7, 2011. Retrieved February 9, 2009.
- ↑ Office for the Coordination of Humanitarian Affairs (November 24, 1998). "Bangladesh: Cyclone Situation Report No. 1". United Nations. Archived from the original on March 17, 2005. Retrieved February 8, 2009.
- ↑ "At least 187 killed after Typhoon Dawn in central Vietnam". ReliefWeb. Agence France-Presse. November 27, 1998. Retrieved July 9, 2011.
- ↑ "Monthly Global Tropical Cyclone Summary December 1998".
- ↑ Bureau of Meteorology. "Bureau – Severe Tropical Cyclone Thelma". Bureau of Meteorology. Retrieved 1 August 2006.
- ↑ "At least 21 die as typhoon hits Vietnam". Agence France-Presse. December 16, 1998. – via Lexis Nexis (subscription required)
- ↑ Destructive Typhoons 1970-2003 (Report). National Disaster Coordinating Council. November 9, 2004. Archived from the original on November 9, 2004. Retrieved July 29, 2017.
- ↑ Staff Writer (December 26, 1998). "Minister sends experts to check Wanakbori weir". Indian Express Newspapers. Retrieved April 15, 2009.
- ↑ Gary Padgett (1999). "Monthly Global Tropical Cyclone Summary, December 1998". Retrieved 18 July 2008.
External links
| Tropical cyclone year articles (1990–1999) |
|---|
| 1990, 1991, 1992, 1993, 1994, 1995, 1996, 1997, 1998, 1999 |
Regional Specialized Meteorological Centers
- US National Hurricane Center – North Atlantic, Eastern Pacific
- Central Pacific Hurricane Center – Central Pacific
- Japan Meteorological Agency – NW Pacific
- India Meteorological Department – Bay of Bengal and the Arabian Sea
- Météo-France – La Reunion – South Indian Ocean from 30°E to 90°E
- Fiji Meteorological Service – South Pacific west of 160°E, north of 25° S
Tropical Cyclone Warning Centers
- Meteorology, Climatology, and Geophysical Agency of Indonesia – South Indian Ocean from 90°E to 141°E, generally north of 10°S
- Australian Bureau of Meteorology (TCWC's Perth, Darwin & Brisbane) – South Indian Ocean & South Pacific Ocean from 90°E to 160°E, generally south of 10°S
- Papua New Guinea National Weather Service – South Pacific Ocean from 141°E to 160°E, generally north of 10°S
- Meteorological Service of New Zealand Limited – South Pacific west of 160°E, south of 25°S
![]() This article incorporates public domain material from websites or documents of the National Weather Service.
This article incorporates public domain material from websites or documents of the National Weather Service.


