| |||||||||||||||||||||||||||||||||||||
23 of the 69 seats to the Edinburgh Corporation 35 seats needed for a majority | |||||||||||||||||||||||||||||||||||||
|---|---|---|---|---|---|---|---|---|---|---|---|---|---|---|---|---|---|---|---|---|---|---|---|---|---|---|---|---|---|---|---|---|---|---|---|---|---|
| |||||||||||||||||||||||||||||||||||||
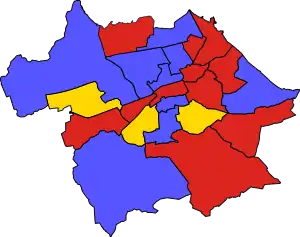 Results by ward. | |||||||||||||||||||||||||||||||||||||
| |||||||||||||||||||||||||||||||||||||
An election to the Edinburgh Corporation was held on 1 May 1962, alongside municipal elections across Scotland. Of the councils 69 seats, 23 were up for election.
After the election Edinburgh Corporation was composed of 34 Progressives, 30 Labour councillors, and 5 Liberals. The Progressives lost their overall majority on the council.
Aggregate results
| Party | Seats | Gains | Losses | Net gain/loss | Seats % | Votes % | Votes | +/− | |
|---|---|---|---|---|---|---|---|---|---|
| Labour | 11 | 1 | 0 | 47.8 | 38.5 | 47,559 | |||
| Progressives | 9 | 0 | 4 | 37.5 | 36.3 | 44,757 | |||
| Liberal | 3 | 3 | 0 | 13.0 | 21.5 | 26,579 | |||
| Unionist | 0 | 0 | 0 | 0.0 | 2.7 | 3,281 | |||
| Communist | 0 | 0 | 0 | 0.0 | 0.8 | 929 | |||
| Union Movement | 0 | 0 | 0 | 0.0 | 0.8 | 929 | |||
Ward Results
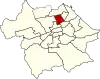
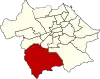
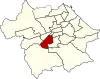
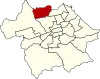
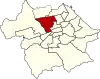
Location of Broughton ward
| Party | Candidate | Votes | % | |
|---|---|---|---|---|
| Progressives | Gottleb A. Theurer | 1,839 | ||
| Liberal | Violet MacInnes | 1,833 | ||
| Majority | 6 | |||
| Turnout | 28.94 | |||
| Progressives hold | ||||
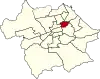
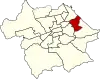
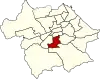
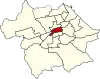
Location of Calton ward
| Party | Candidate | Votes | % | |
|---|---|---|---|---|
| Labour | James S. Cook | 2,135 | ||
| Progressives | Josephine M. Dickson | 2,120 | ||
| Majority | 15 | |||
| Turnout | 36.80 | |||
| Labour gain from Progressives | ||||
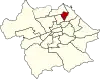
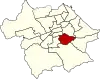
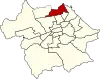
Location of Central Leith ward
| Party | Candidate | Votes | % | |
|---|---|---|---|---|
| Labour | Ewen G. Bethune | 2,970 | ||
| Progressives | Linddsay Wilkie | 1,185 | ||
| Communist | Theodore C. Taylor | 193 | ||
| Majority | 1,785 | |||
| Turnout | 34.66 | |||
| Labour hold | ||||
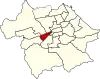
Location of Colinton ward
| Party | Candidate | Votes | % | |
|---|---|---|---|---|
| Progressives | Herbert A. Brechin | 4,089 | ||
| Progressives | Maurice F. Ferry | 3,795 | ||
| Labour | Harold Fauxwell | 2,409 | ||
| Labour | Sylvia Dorothy Renilson | 2,297 | ||
| Majority | 394 | |||
| Turnout | 36.99 | |||
| Progressives hold | ||||
| Progressives hold | ||||

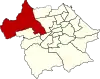
Location of Corstorphine ward
| Party | Candidate | Votes | % | |
|---|---|---|---|---|
| Liberal | Ronald S. Grant | 3,658 | ||
| Progressives | David Kyles | 3,361 | ||
| Majority | 297 | |||
| Turnout | 45.16 | |||
| Liberal gain from Progressives | ||||
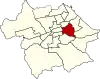
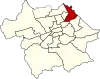
Location of Craigentinny ward
| Party | Candidate | Votes | % | |
|---|---|---|---|---|
| Labour | George Drummond | 3,992 | ||
| Progressives | Henry Dundas | 1,946 | ||
| Majority | 2,046 | |||
| Turnout | 39.93 | |||
| Labour hold | ||||

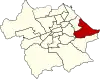
Location of Craigmillar ward
| Party | Candidate | Votes | % | |
|---|---|---|---|---|
| Labour | Donald F. Renton | 2,619 | ||
| Communist | Michael D'Arcy | 175 | ||
| Majority | 2,444 | |||
| Turnout | 28.19 | |||
| Labour hold | ||||

Location of George Square ward
| Party | Candidate | Votes | % | |
|---|---|---|---|---|
| Progressives | William Simpson-Bell | 1,859 | ||
| Liberal | John G. Gray | 1,744 | ||
| Labour | Owen Hand | 832 | ||
| Majority | ||||
| Turnout | ||||
| Progressives hold | ||||
Location of Gorgie-Dalry ward
| Party | Candidate | Votes | % | |
|---|---|---|---|---|
| Labour | Florence A. R. Strachan | 3,038 | ||
| Progressives | William W. Gilmour | 1,463 | ||
| Communist | Irene Swan | 176 | ||
| Majority | 1,575 | |||
| Turnout | 32.65 | |||
| Labour hold | ||||
Location of Holyrood ward
| Party | Candidate | Votes | % | |
|---|---|---|---|---|
| Labour | Norman F. McQueen | 1,987 | ||
| Communist | John Ashton | 215 | ||
| Majority | 1,772 | |||
| Turnout | 23.51 | |||
| Labour hold | ||||

Location of Liberton ward
| Party | Candidate | Votes | % | |
|---|---|---|---|---|
| Labour | M. Mackenzie | 4,849 | ||
| Progressives | Enid Fraser | 3,237 | ||
| Majority | 1,612 | |||
| Turnout | 40.69 | |||
| Labour hold | ||||
Location of Merchiston ward
| Party | Candidate | Votes | % | |
|---|---|---|---|---|
| Liberal | Robert L. Smith | 2,939 | ||
| Progressives | Vera M. Carmichael | 2,222 | ||
| Majority | 717 | |||
| Turnout | 44.50 | |||
| Liberal gain from Progressives | ||||
Location of Morningside ward
| Party | Candidate | Votes | % | |
|---|---|---|---|---|
| Progressives | John Fitzpatrick | 3,439 | ||
| Liberal | James B. Crossland | 2,010 | ||
| Majority | 1,429 | |||
| Turnout | 41.05 | |||
| Progressives hold | ||||
Location of Murrayfield-Cramond ward
| Party | Candidate | Votes | % | |
|---|---|---|---|---|
| Progressives | Robert M. Knox | 3,176 | ||
| Liberal | Melville MacIntyre | 2,364 | ||
| Labour | John Keddie | 1,399 | ||
| Majority | 812 | |||
| Turnout | 41.60 | |||
| Progressives hold | ||||
Location of Newington ward
| Party | Candidate | Votes | % | |
|---|---|---|---|---|
| Liberal | William G. Henderson | 3,363 | ||
| Unionist | D. Drummond-Young | 3,281 | ||
| Labour | John M. Simpson | 1,140 | ||
| Majority | 82 | |||
| Turnout | 47.85 | |||
| Liberal gain from Progressives | ||||
Location of Pilton ward
| Party | Candidate | Votes | % | |
|---|---|---|---|---|
| Labour | Catherina T. Nealon | 5,219 | ||
| Liberal | Desmond V. S. Williams | 1,506 | ||
| Communist | Charlie McManus | 170 | ||
| Majority | 3,713 | |||
| Turnout | 39.58 | |||
| Labour hold | ||||
Location of Portobello ward
| Party | Candidate | Votes | % | |
|---|---|---|---|---|
| Progressives | Alfred H. Hunt | 2,928 | ||
| Labour | Robert G. Blanche | 2,414 | ||
| Liberal | John M. Farquhar | 2,058 | ||
| Majority | 514 | |||
| Turnout | 40.58 | |||
| Progressives hold | ||||
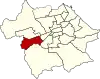
Location of Sighthill ward
| Party | Candidate | Votes | % | |
|---|---|---|---|---|
| Labour | James Ross | 3,927 | ||
| Liberal | John Lisman | 1,929 | ||
| Majority | 1,998 | |||
| Turnout | 38.29 | |||
| Labour hold | ||||
Location of South Leith
| Party | Candidate | Votes | % | |
|---|---|---|---|---|
| Labour | Walter S. Dalgleish | 3,859 | ||
| Progressives | Eric Walker Hall | 3,153 | ||
| Majority | 706 | |||
| Turnout | 51.19 | |||
| Labour hold | ||||

Location of St Andrews ward
| Party | Candidate | Votes | % | |
|---|---|---|---|---|
| Progressives | Lawrence S. Miller | 1,907 | ||
| Labour | Anna F. Flockhart | 930 | ||
| Union Movement | Stanley E. Wallace | 280 | ||
| Majority | 977 | |||
| Turnout | 28.56 | |||
| Progressives hold | ||||
Location of St Bernards ward
| Party | Candidate | Votes | % | |
|---|---|---|---|---|
| Progressives | Rhoda E. Paul | 3,362 | ||
| Liberal | Marion M. Ritchie | 1,931 | ||
| Labour | Ian McLauchlan | 1,788 | ||
| Majority | 1,431 | |||
| Turnout | 40.19 | |||
| Progressives hold | ||||
Location of St Giles ward
| Party | Candidate | Votes | % | |
|---|---|---|---|---|
| Labour | Margaret B. Smith | 2,052 | ||
| Progressives | Brenda A. W. Pope | 959 | ||
| Majority | 1,093 | |||
| Turnout | 23.74 | |||
| Labour hold | ||||
Location of West Leith ward
| Party | Candidate | Votes | % | |
|---|---|---|---|---|
| Progressives | Duncan M. Weatherstone | 2,512 | ||
| Liberal | Peter E. Taylor | 1,244 | ||
| Majority | 1,268 | |||
| Turnout | 3,756 | 31.66 | ||
| Progressives hold | ||||
References
| Edinburgh Corporation |
|
|---|---|
| City of Edinburgh District Council | |
| Lothian Regional Council | |
| City of Edinburgh Council | |
| Referendums | |
(1961 ←) | |
|---|---|
| Metropolitan boroughs |
|
| City corporations |
|
This article is issued from Wikipedia. The text is licensed under Creative Commons - Attribution - Sharealike. Additional terms may apply for the media files.