| ||||||||||||||||||||||||||||||||||||||||||||||||||||||||||||||||||||||||
23 of the 69 seats to the Edinburgh Corporation 35 seats needed for a majority | ||||||||||||||||||||||||||||||||||||||||||||||||||||||||||||||||||||||||
|---|---|---|---|---|---|---|---|---|---|---|---|---|---|---|---|---|---|---|---|---|---|---|---|---|---|---|---|---|---|---|---|---|---|---|---|---|---|---|---|---|---|---|---|---|---|---|---|---|---|---|---|---|---|---|---|---|---|---|---|---|---|---|---|---|---|---|---|---|---|---|---|---|
| ||||||||||||||||||||||||||||||||||||||||||||||||||||||||||||||||||||||||
 Results by ward. | ||||||||||||||||||||||||||||||||||||||||||||||||||||||||||||||||||||||||
| ||||||||||||||||||||||||||||||||||||||||||||||||||||||||||||||||||||||||
An Election to the Edinburgh Corporation was held on 1 May 1973, alongside municipal elections across Scotland. Of the councils 69 seats, 26 were up for election. Labour, despite needing only 1 gain to take control of the council, failed to do so, preventing them from a historic win.[1]
Following the election, with two by-elections pending, Edinburgh Corporation was composed of 34 Labour councillors, 21 Conservatives, and 7 Liberals, with 5 others.[1]
By this point only a small rump Progressive party remained on the council, with the bulk of Progressive councillors having joined the Conservatives. A small number, such as Mrs Catherine Filsell (a former Progressive leader), had joined Labour.[1]
Aggregate results
| Party | Seats | Gains | Losses | Net gain/loss | Seats % | Votes % | Votes | +/− | |
|---|---|---|---|---|---|---|---|---|---|
| Labour | 13 | 2 | 2 | 50.0 | 37.8 | 44,456 | |||
| Conservative | 9 | 3 | 2 | 26.9 | 25.3 | 29,806 | |||
| Liberal | 3 | 1 | 0 | 11.5 | 17.1 | 20,155 | |||
| Progressives | 1 | 0 | 1 | 11.5 | 14.8 | 17,406 | |||
| SNP | 0 | 0 | 0 | 0.0 | 3.5 | 4,065 | |||
| Communist | 0 | 0 | 0 | 0.0 | 1.1 | 1,267 | |||
| Wester Hailes Association of Tenants | 0 | 0 | 0 | 0.0 | 0.3 | 312 | |||
| Independent Local Community | 0 | 0 | 0 | 0.0 | 0.1 | 146 | |||
| Independent | 0 | 0 | 0 | 0.0 | 0.0 | 0 | |||
Ward Results
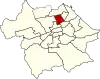
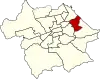
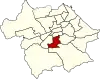
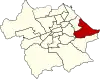
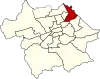
Location of Broughton ward
| Party | Candidate | Votes | % | |
|---|---|---|---|---|
| Conservative | W. R. V. Percy | 1,811 | ||
| Labour | M. J. O'Neill | 1,317 | ||
| Liberal | Elizabeth R. Barclay | 867 | ||
| Majority | 494 | |||
| Turnout | 32.64% | |||
| Conservative hold | ||||
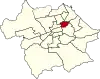
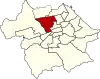
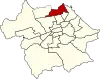
Location of Calton ward
| Party | Candidate | Votes | % | |
|---|---|---|---|---|
| Labour | J. Cook | 2,065 | ||
| Conservative | A. G. Jackson | 1,426 | ||
| Majority | 839 | |||
| Turnout | 34.76% | |||
| Labour hold | ||||
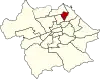
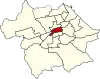
Location of Central Leith ward
| Party | Candidate | Votes | % | |
|---|---|---|---|---|
| Labour | T. McGregor | 1,695 | ||
| Conservative | D. C. Dow | 485 | ||
| SNP | J. L. Geddea | 429 | ||
| Majority | 1,210 | |||
| Turnout | 26.33% | |||
| Labour hold | ||||
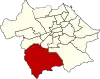
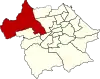
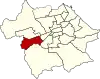
Location of Colinton ward
| Party | Candidate | Votes | % | |
|---|---|---|---|---|
| Conservative | A. H. Leater | 5,442 | ||
| Labour | J. H. McKay | 3,956 | ||
| SNP | J. McKernan | 914 | ||
| Wester Hailes Association of Tenants | J. Henderson | 312 | ||
| Majority | 1,486 | |||
| Turnout | 40.18% | |||
| Conservative gain from Labour | ||||

Location of Corstorphine ward
| Party | Candidate | Votes | % | |
|---|---|---|---|---|
| Liberal | D. C. E. Gorrie | 4,773 | ||
| Progressives | R. P. Haig | 2,677 | ||
| Labour | W. Wallace | 629 | ||
| Majority | 2,096 | |||
| Turnout | 45.11% | |||
| Liberal hold | ||||
Location of Craigentinny ward
| Party | Candidate | Votes | % | |
|---|---|---|---|---|
| Labour | Phyllis Herriot | 3,253 | ||
| Conservative | G. V. McArn | 1,978 | ||
| Communist | T. Burns | 116 | ||
| Majority | 1275 | |||
| Turnout | 36.17% | |||
| Labour hold | ||||

Location of Craigmillar ward
| Party | Candidate | Votes | % | |
|---|---|---|---|---|
| Labour | D. H. Brown | 2,722 | ||
| Communist | J. O'Donnell | 132 | ||
| Majority | 2,590 | |||
| Turnout | 18.93% | |||
| Labour hold | ||||

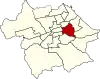
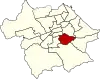
Location of George Square ward
| Party | Candidate | Votes | % | |
|---|---|---|---|---|
| Labour | J. F. Stephenm | 1,705 | ||
| Labour | W. I. Taylor | 1,598 | ||
| Conservative | W. Reid | 1,587 | ||
| Conservative | J. Slack | 1,545 | ||
| Liberal | M. G. Falchikov | 847 | ||
| Majority | 11 | |||
| Turnout | 74.58% | |||
| Labour gain from Conservative | ||||
| Labour gain from Conservative | ||||
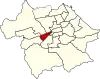
Location of Gorgie-Dalry ward
| Party | Candidate | Votes | % | |
|---|---|---|---|---|
| Labour | D. M. Swinson | 2,061 | ||
| Conservative | Fiona M. Cameron | 959 | ||
| Liberal | D. R. Irving | 577 | ||
| SNP | E. J. Milne | 461 | ||
| Majority | 1,102 | |||
| Turnout | 30.57% | |||
| Labour hold | ||||
Location of Holyrood ward
| Party | Candidate | Votes | % | |
|---|---|---|---|---|
| Labour | B. C. Rutherford | 1,262 | ||
| Conservative | L. Taylor | 617 | ||
| Majority | 645 | |||
| Turnout | 28.25% | |||
| Labour hold | ||||

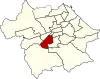
Location of Liberton ward
| Party | Candidate | Votes | % | |
|---|---|---|---|---|
| Labour | J. D. McWilliam | 5,122 | ||
| Conservative | Susan K. Elliot | 3,097 | ||
| Communist | W. Cowan | 133 | ||
| Majority | 2,025 | |||
| Turnout | 32.43% | |||
| Labour hold | ||||
Location of Merchiston ward
| Party | Candidate | Votes | % | |
|---|---|---|---|---|
| Liberal | R. L. Smith | 3,129 | ||
| Conservative | Sarah A. Pringle | 1,545 | ||
| Labour | A. M. M. Black | 577 | ||
| SNP | G. Bishop | 196 | ||
| Majority | 1,584 | |||
| Turnout | 46.72% | |||
| Liberal hold | ||||
Location of Morningside ward
| Party | Candidate | Votes | % | |
|---|---|---|---|---|
| Liberal | N. L. Gordon | 3,676 | ||
| Progressives | H. Mansbridge | 2,910 | ||
| SNP | W. Black | 359 | ||
| Majority | 766 | |||
| Turnout | 50.36% | |||
| Liberal gain from Progressives | ||||
Location of Murrayfield-Cramond ward
| Party | Candidate | Votes | % | |
|---|---|---|---|---|
| Conservative | J. A. Douglas-Hamilton | 4,772 | ||
| Labour | P. E. McGhee | 1,807 | ||
| Liberal | E. Sutherland | 1,391 | ||
| Majority | 2965 | |||
| Turnout | 35.20% | |||
| Conservative hold | ||||
Location of Newington ward
| Party | Candidate | Votes | % | |
|---|---|---|---|---|
| Conservative | Malcolm Rifkind | 3,654 | 29.92 | |
| Conservative | Margaret E. S. Houston | 3,266 | 26.74 | |
| Labour | B. Mackenzie | 1,890 | 15.48 | |
| Liberal | J. R. MacGillivray | 1,784 | 14.61 | |
| SNP | R. J. D. Scott | 713 | 5.84 | |
| SNP | D. Kelbie | 701 | 5.74 | |
| Communist | Michele Gunn | 204 | 1.67 | |
| Majority | 1376 | |||
| Turnout | 73.60% | |||
| Conservative hold | ||||
| Conservative gain from Independent | ||||
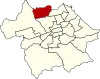
Location of Pilton ward
| Party | Candidate | Votes | % | |
|---|---|---|---|---|
| Labour | M. J. Williamson | 2,715 | ||
| SNP | G. W. Telford | 993 | ||
| Conservative | J. Johnston | 649 | ||
| Communist | C. McManus | 128 | ||
| Majority | 1,722 | |||
| Turnout | 23.70% | |||
| Labour hold | ||||
Location of Portobello ward
| Party | Candidate | Votes | % | |
|---|---|---|---|---|
| Conservative | J. Cavaye | 3,350 | ||
| Labour | Mary Hutchison | 1,501 | ||
| Majority | 1,849 | |||
| Turnout | 33.94% | |||
| Conservative hold | ||||

Location of St Andrews ward
| Party | Candidate | Votes | % | |
|---|---|---|---|---|
| Conservative | A. Brown | 968 | ||
| Liberal | C. S. Waterman | 910 | ||
| Labour | E. Milligan | 504 | ||
| Majority | 58 | |||
| Turnout | 32.66% | |||
| Conservative hold | ||||
Location of St Bernards ward
| Party | Candidate | Votes | % | |
|---|---|---|---|---|
| Conservative | J. Millar | 3,075 | ||
| Labour | Gertrude Barton | 1,868 | ||
| Liberal | R. H. Guild | 1,631 | ||
| Independent Local Community | A. Stevenson | 146 | ||
| Majority | 1,207 | |||
| Turnout | 37.42% | |||
| Conservative hold | ||||
Location of St Giles ward
| Party | Candidate | Votes | % | |
|---|---|---|---|---|
| Labour | Elizabeth R. Mackenzie | 999 | ||
| Labour | C. Stuart | 994 | ||
| Conservative | H. Lorimer | 490 | ||
| Conservative | Caroline Peploe | 451 | ||
| Majority | 504 | |||
| Turnout | 36.82% | |||
| Labour hold | ||||
Location of Sighthill ward
| Party | Candidate | Votes | % | |
|---|---|---|---|---|
| Labour | G. Foulkes | 3,375 | ||
| Conservative | G. A. R. Fenson | 680 | ||
| Liberal | A. Burnett | 570 | ||
| SNP | R. Mackenna | 554 | ||
| Communist | W. M.Millar | 60 | ||
| Majority | 2695 | |||
| Turnout | 28.47% | |||
| Labour hold | ||||
Location of South Leith
| Party | Candidate | Votes | % | |
|---|---|---|---|---|
| Conservative | C. Waugh | 2,061 | ||
| Labour | J. Boyack | 2,000 | ||
| Majority | 61 | |||
| Turnout | 35.60% | |||
| Conservative gain from Labour | ||||
Location of West Leith ward
| Party | Candidate | Votes | % | |
|---|---|---|---|---|
| Progressives | Margaret B. A. Ross | 2,979 | ||
| Labour | N. Lindsay | 1,433 | ||
| Majority | 1,546 | |||
| Turnout | 39.18% | |||
| Progressives hold | ||||
References
| Edinburgh Corporation |
|
|---|---|
| City of Edinburgh District Council | |
| Lothian Regional Council | |
| City of Edinburgh Council | |
| Referendums | |
| County councils (England) |
|
|---|---|
| County councils (Wales) |
|
| County councils (Scotland) |
|
| Unicameral area | |
| Metropolitan boroughs |
|
| City corporations | |
| District councils (England) |
|
| District councils (Wales) |
|
| District councils (Northern Ireland) | |
| Town councils |
|
| Sui generis |
|
This article is issued from Wikipedia. The text is licensed under Creative Commons - Attribution - Sharealike. Additional terms may apply for the media files.