| |||||||||||||||||||||||||||||||||||||||||||||||||||||||||||||||||||||
23 of the 69 seats to the Edinburgh Corporation 35 seats needed for a majority | |||||||||||||||||||||||||||||||||||||||||||||||||||||||||||||||||||||
|---|---|---|---|---|---|---|---|---|---|---|---|---|---|---|---|---|---|---|---|---|---|---|---|---|---|---|---|---|---|---|---|---|---|---|---|---|---|---|---|---|---|---|---|---|---|---|---|---|---|---|---|---|---|---|---|---|---|---|---|---|---|---|---|---|---|---|---|---|---|
| |||||||||||||||||||||||||||||||||||||||||||||||||||||||||||||||||||||
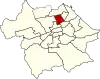
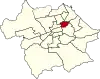
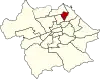
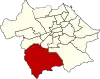
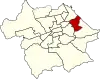
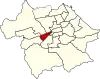
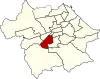
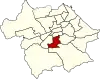
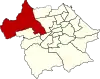
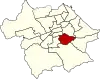
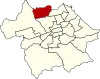
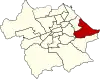
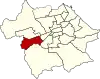
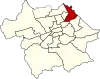
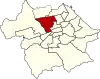
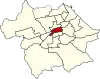
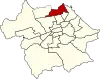
 Results by ward. | |||||||||||||||||||||||||||||||||||||||||||||||||||||||||||||||||||||
| |||||||||||||||||||||||||||||||||||||||||||||||||||||||||||||||||||||
An Election to the Edinburgh Corporation was held on 7 May 1968, alongside municipal elections across Scotland. Of the councils 69 seats, 22 were up for election. Despite receiving the most votes of any single party, the SNP won only 7 seats. Unlike in Glasgow, the Progressives and Conservatives did not run on a joint ticket.[1] Despite that however the parties only ran competing candidates in the Gorgie-Dalry ward.
Following the election Edinburgh Corporation was composed of 34 Progressives (including the Lord Provost), 21 Labour councillors, 8 SNP councillors, 3 Conservatives, 1 Liberal, and 1 independent. Following the election the Progressive/Conservative coalition controlled the council with a majority of 6.
No election was held in the Holyrood ward, where the sitting Labour councillor died the week before the election.
Turnout was 140,987.
Aggregate results
| Party | Seats | Gains | Losses | Net gain/loss | Seats % | Votes % | Votes | +/− | |
|---|---|---|---|---|---|---|---|---|---|
| Progressives | 10 | 0 | 0 | 45.45 | 26.87 | 37,885 | |||
| SNP | 7 | 6 | 0 | 31.82 | 34.83 | 49,111 | |||
| Labour | 3 | 0 | 2 | 13.64 | 19.15 | 26,997 | |||
| Conservative | 1 | 1 | 0 | 4.55 | 9.72 | 13,715 | |||
| Liberal | 1 | 0 | 0 | 4.55 | 6.46 | 9,105 | |||
| Communist | 0 | 0 | 0 | 0 | 1.74 | 2,462 | |||
| Ind. Conservative | 0 | 0 | 0 | 0 | 1.21 | 1,712 | |||
Ward Results
| Party | Candidate | Votes | % | |
|---|---|---|---|---|
| Progressives | A. Theurer | 2,239 | ||
| SNP | C. MacDougall | 2,042 | ||
| Liberal | E. W. Hall | 819 | ||
| Labour | I. R. Hoy | 744 | ||
| Majority | 197 | |||
| Turnout | 48.31 | |||
| Progressives hold | ||||
| Party | Candidate | Votes | % | |
|---|---|---|---|---|
| SNP | W. Thomson | 1,671 | ||
| Progressives | A. D. Wilson | 1,637 | ||
| Labour | S. Cook | 1,196 | ||
| Majority | 34 | |||
| Turnout | 43.22 | |||
| SNP gain from Labour | ||||
| Party | Candidate | Votes | % | |
|---|---|---|---|---|
| SNP | F. T. Chalmers | 1,898 | ||
| Labour | T. H. Greig | 1,393 | ||
| Progressives | D. Valentine | 706 | ||
| Communist | T. C. Taylor | 86 | ||
| Majority | 505 | |||
| Turnout | 36.51 | |||
| SNP gain from Labour | ||||
| Party | Candidate | Votes | % | |
|---|---|---|---|---|
| Progressives | D. M. Cameron | 4,671 | ||
| SNP | A. Westwood | 3,389 | ||
| Labour | R. D. M. Brown | 1,450 | ||
| Majority | 1282 | |||
| Turnout | 48.71 | |||
| Progressives hold | ||||

| Party | Candidate | Votes | % | |
|---|---|---|---|---|
| Progressives | F. Ford | 3,689 | ||
| SNP | A. McCallum | 2,982 | ||
| Liberal | Vera P. Heggie | 1,795 | ||
| Majority | 707 | |||
| Turnout | 51.29 | |||
| Progressives hold | ||||
| Party | Candidate | Votes | % | |
|---|---|---|---|---|
| Labour | G. Drummond | 2,627 | ||
| SNP | R. Anderson | 2,566 | ||
| Conservative | Geraldine R. Johnston | 1,586 | ||
| Majority | 61 | |||
| Turnout | 47.89 | |||
| Labour hold | ||||

| Party | Candidate | Votes | % | |
|---|---|---|---|---|
| SNP | R. Dalrymple | 2,590 | ||
| Labour | D. F. Renton | 2,081 | ||
| Conservative | D. R. Anderson | 823 | ||
| Communist | M. D'Arcy | 145 | ||
| Majority | 509 | |||
| Turnout | 40.0 | |||
| SNP gain from Labour | ||||

| Party | Candidate | Votes | % | |
|---|---|---|---|---|
| Progressives | W. Simpson-Bell | 1,601 | ||
| SNP | T. C. Bogle | 1,331 | ||
| Liberal | P.L. Newman | 630 | ||
| Majority | 270 | |||
| Turnout | 36.59 | |||
| Progressives hold | ||||
| Party | Candidate | Votes | % | |
|---|---|---|---|---|
| SNP | T. McCarron | 2,088 | ||
| Labour | J. E. Boyack | 1,591 | ||
| Conservative | M. Pirie | 1,481 | ||
| Progressives | Miss Mar A. M. Hislop | 511 | ||
| Liberal | R. T. Parker | 140 | ||
| Communist | M. R. Currie | 78 | ||
| Majority | 497 | |||
| Turnout | 44.02 | |||
| SNP hold | ||||

| Party | Candidate | Votes | % | |
|---|---|---|---|---|
| Labour | P. Wilson | 4,290 | ||
| SNP | A. G. Symington | 3,635 | ||
| Conservative | J. F. Doyle | 3,259 | ||
| Communist | J. Ashton | 195 | ||
| Majority | 655 | |||
| Turnout | 51.83 | |||
| Labour hold | ||||
| Party | Candidate | Votes | % | |
|---|---|---|---|---|
| Liberal | R. L. Smith | 2,803 | ||
| Conservative | B. A. Meek | 1,800 | ||
| SNP | T. J. D. MacDonald | 1,368 | ||
| Majority | 1003 | |||
| Turnout | 53.92 | |||
| Liberal hold | ||||
| Party | Candidate | Votes | % | |
|---|---|---|---|---|
| Progressives | R. Lorimer | 3,025 | ||
| SNP | Catherina Moore | 1,748 | ||
| Conservative | Sir Alexander Giles | 1,650 | ||
| Majority | 1,277 | |||
| Turnout | 6,423 | 50.16 | ||
| Progressives hold | ||||
| Party | Candidate | Votes | % | |
|---|---|---|---|---|
| Progressives | J. W. McKay | 5,400 | ||
| SNP | R. A. Macdonald | 3,181 | ||
| Labour | C. T. Harvie | 1,281 | ||
| Majority | 2,219 | |||
| Turnout | 9,862 | 50.55 | ||
| Progressives hold | ||||
| Party | Candidate | Votes | % | |
|---|---|---|---|---|
| Progressives | E. M. Kean | 3,761 | ||
| SNP | G. W. Telford | 2,745 | ||
| Labour | J. C. Campbell | 985 | ||
| Liberal | J. Grahamslaw | 909 | ||
| Majority | 1016 | |||
| Turnout | 53.37 | |||
| Progressives hold | ||||
| Party | Candidate | Votes | % | |
|---|---|---|---|---|
| Labour | Catherina T. Nealon | 2,913 | ||
| SNP | W. Thompson | 2,724 | ||
| Conservative | R. Beattie | 795 | ||
| Communist | C. McManus | 147 | ||
| Majority | 189 | |||
| Turnout | 34.33 | |||
| Labour hold | ||||
| Party | Candidate | Votes | % | |
|---|---|---|---|---|
| Progressives | A. W. Hunt | 2,873 | ||
| SNP | R. G. Kelly | 2,687 | ||
| Labour | D. H. Brown | 869 | ||
| Liberal | G. H. T. Harvie | 593 | ||
| Majority | 186 | |||
| Turnout | 51.74 | |||
| Progressives hold | ||||
| Party | Candidate | Votes | % | |
|---|---|---|---|---|
| SNP | G. D. M. Galbraith | 3,621 | ||
| Labour | J. Ross | 2,583 | ||
| Liberal | W. McLoed | 533 | ||
| Communist | W. M. Millar | 134 | ||
| Majority | 1,038 | |||
| Turnout | 45.35 | |||
| SNP gain from Labour | ||||
| Party | Candidate | Votes | % | |
|---|---|---|---|---|
| SNP | Mary G. Thompson | 2,320 | ||
| Progressives | L. Scott | 1,922 | ||
| Labour | W. S. Dalgleish | 1,708 | ||
| Majority | 398 | |||
| Turnout | 47.01 | |||
| Progressives gain from Labour | ||||

| Party | Candidate | Votes | % | |
|---|---|---|---|---|
| Conservative | D. Drummond-Young | 1,661 | ||
| SNP | I. A. Macdonald | 1,056 | ||
| Labour | I. L. Foggie | 401 | ||
| Majority | 605 | |||
| Turnout | 39.19 | |||
| Conservative gain from Progressives | ||||
| Party | Candidate | Votes | % | |
|---|---|---|---|---|
| Progressives | Winifred E. Donaldson | 3,436 | ||
| SNP | W. K. Archibald | 2,321 | ||
| Liberal | Joyce Shein | 883 | ||
| Ind. Conservative | Elva G. Speyer | 567 | ||
| Majority | 1,115 | |||
| Turnout | 42.78 | |||
| Progressives hold | ||||
| Party | Candidate | Votes | % | |
|---|---|---|---|---|
| SNP | J. McCann | 1,148 | ||
| Labour | P. S. Wood | 885 | ||
| Conservative | D. B. Harvey | 660 | ||
| Majority | 263 | |||
| Turnout | 27.03 | |||
| SNP gain from Labour | ||||
| Party | Candidate | Votes | % | |
|---|---|---|---|---|
| Progressives | J. Scott | 2,925 | 71.87 | |
| Ind. Conservative | A. H. Lester | 1,145 | 28.13 | |
| Majority | 1780 | 43.74 | ||
| Turnout | 4070 | 36.90 | ||
| Progressives hold | ||||
References
| London boroughs |
|
|---|---|
| County boroughs | |
| City corporations | |
Elections in the London boroughs were due in May 1967, but were postponed one year by the London Government Act 1967. | |
| Edinburgh Corporation |
|
|---|---|
| City of Edinburgh District Council | |
| Lothian Regional Council | |
| City of Edinburgh Council | |
| Referendums | |