| ||||||||||||||||||||||||||
| ||||||||||||||||||||||||||


| ||||||||||||||||||||||||||
| ||||||||||||||||||||||||||
| Elections in Oregon |
|---|
 |
2012 U.S. presidential election | |
|---|---|
| Democratic Party | |
| Republican Party | |
| Related races | |
| |
The 2012 United States presidential election in Oregon took place on November 6, 2012, as part of the 2012 United States presidential election in which all 50 states plus the District of Columbia participated. Oregon voters chose seven electors to represent them in the Electoral College via a popular vote pitting incumbent Democratic President Barack Obama and his running mate, Vice President Joe Biden, against Republican challenger and former Massachusetts Governor Mitt Romney and his running mate, Representative Paul Ryan.
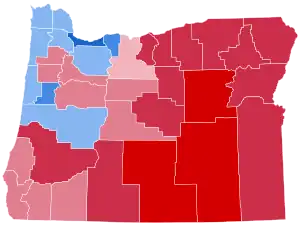
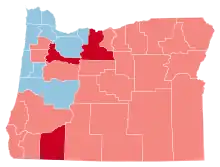
Obama carried Oregon with 54.24% of the vote to Romney's 42.15%, a Democratic victory margin of 12.09%. The Democrats have won the state in every presidential election since 1988, and the Republicans would never seriously contest the state after the 2004 election. Though Romney won a majority of counties, his best performances were in the most sparsely populated regions of the state. Obama's win came from strong support in the densely populated northwestern region of the state, home to Oregon's largest metropolitan areas. Obama won over 75% of the vote in Multnomah County, containing Portland, as well as its surrounding counties, enough to deliver the state to the Democrats by a strong margin. However, the Republican Party managed to improve on their 2008 loss of 16.35%[1] and flipped the counties of Jackson (home to Medford), Marion (home to Salem), and Wasco back into the Republican column.
Obama was the first Democrat since 1948 to win without Wasco County. As of the 2020 presidential election, this is the last time where Columbia County and Tillamook County backed the Democratic candidate.
Primary elections
Democratic primary
The Democratic primary was held on May 15, 2012. Barack Obama ran unopposed for the nomination.
| Party | Candidate | Votes | % | |
|---|---|---|---|---|
| Democratic | Barack Obama | 309,358 | 94.79% | |
| Democratic | write-ins | 16,998 | 5.21% | |
| Total votes | 326,358 | 100.00% | ||
Republican primary
| |||||||||||||||||||||||||||||||||||||||||
| |||||||||||||||||||||||||||||||||||||||||
 Oregon results by county
Mitt Romney
(Note: Italicization indicates a withdrawn candidacy) | |||||||||||||||||||||||||||||||||||||||||
The Republican primary was held on May 15, 2012.[3][4] The only two candidates still in the race were Mitt Romney and U.S. Representative from Texas, Ron Paul. In addition, former Senator from Pennsylvania Rick Santorum and former Speaker of the House Newt Gingrich had withdrawn prior to the election, but their names still appeared on the Oregon ballot.
In order to participate in the primary, voters were required to register to vote by April 24, 2012.[5] A closed primary was used to elect the presidential, legislative, and local partisan offices. A semi-closed primary, which allowed non-affiliated voters to participate, was used to elect the Attorney General, Secretary of State and Treasurer.[6]
| Party | Candidate | Votes | % | |
|---|---|---|---|---|
| Republican | Mitt Romney | 204,176 | 70.91% | |
| Republican | Ron Paul | 36,810 | 12.78% | |
| Republican | Rick Santorum (withdrew) | 27,042 | 9.39% | |
| Republican | Newt Gingrich (withdrew) | 15,451 | 5.37% | |
| Republican | write-ins | 4,476 | 1.55% | |
| Total votes | 287,955 | 100.00% | ||
General election
Results
| Party | Candidate | Votes | % | |
|---|---|---|---|---|
| Democratic | Barack Obama | 970,488 | 54.24% | |
| Republican | Mitt Romney | 754,175 | 42.15% | |
| Libertarian | Gary Johnson | 24,089 | 1.35% | |
| Pacific Green | Jill Stein | 19,427 | 1.09% | |
| Constitution | Will Christensen | 4,432 | 0.25% | |
| Progressive | Rocky Anderson | 3,384 | 0.19% | |
| write-ins | 13,275 | 0.74% | ||
| Total votes | 1,789,270 | 100.00% | ||
By county
| County | Barack Obama Democratic |
Mitt Romney Republican |
Various candidates Other parties |
Margin | Total votes cast | ||||
|---|---|---|---|---|---|---|---|---|---|
| # | % | # | % | # | % | # | % | ||
| Baker | 2,369 | 28.04% | 5,702 | 67.50% | 377 | 4.46% | -3,333 | -39.46% | 8,448 |
| Benton | 27,776 | 62.00% | 14,991 | 33.46% | 2,035 | 4.54% | 12,785 | 28.54% | 44,802 |
| Clackamas | 95,493 | 50.44% | 88,592 | 46.79% | 5,247 | 2.77% | 6,901 | 3.65% | 189,332 |
| Clatsop | 9,861 | 55.34% | 7,249 | 40.68% | 708 | 3.98% | 2,612 | 14.66% | 17,818 |
| Columbia | 12,004 | 50.28% | 10,772 | 45.12% | 1,099 | 4.60% | 1,232 | 5.16% | 23,875 |
| Coos | 12,845 | 44.78% | 14,673 | 51.15% | 1,168 | 4.07% | -1,828 | -6.37% | 28,686 |
| Crook | 3,104 | 30.34% | 6,790 | 66.37% | 336 | 3.29% | -3,686 | -36.03% | 10,230 |
| Curry | 4,625 | 39.60% | 6,598 | 56.50% | 455 | 3.90% | -1,973 | -16.90% | 11,678 |
| Deschutes | 36,961 | 45.13% | 42,463 | 51.85% | 2,476 | 3.02% | -5,502 | -6.72% | 81,900 |
| Douglas | 17,145 | 34.43% | 30,776 | 61.80% | 1,882 | 3.77% | -13,631 | -27.37% | 49,803 |
| Gilliam | 371 | 34.97% | 639 | 60.23% | 51 | 4.80% | -268 | -25.26% | 1,061 |
| Grant | 853 | 21.81% | 2,926 | 74.81% | 132 | 3.38% | -2,073 | -53.00% | 3,911 |
| Harney | 832 | 23.22% | 2,607 | 72.76% | 144 | 4.02% | -1,775 | -49.54% | 3,583 |
| Hood River | 6,058 | 61.58% | 3,429 | 34.85% | 351 | 3.57% | 2,629 | 26.73% | 9,838 |
| Jackson | 44,468 | 45.78% | 49,020 | 50.47% | 3,639 | 3.75% | -4,552 | -4.69% | 97,127 |
| Jefferson | 3,301 | 40.38% | 4,642 | 56.78% | 232 | 2.84% | -1,341 | -16.40% | 8,175 |
| Josephine | 14,953 | 37.16% | 23,673 | 58.83% | 1,612 | 4.01% | -8,720 | -21.67% | 40,238 |
| Klamath | 8,302 | 29.49% | 18,898 | 67.13% | 952 | 3.38% | -10,596 | -37.64% | 28,152 |
| Lake | 770 | 20.75% | 2,808 | 75.69% | 132 | 3.56% | -2,038 | -54.94% | 3,710 |
| Lane | 102,652 | 59.73% | 62,509 | 36.37% | 6,689 | 3.90% | 40,143 | 23.36% | 171,850 |
| Lincoln | 13,401 | 58.31% | 8,686 | 37.79% | 897 | 3.90% | 4,715 | 20.52% | 22,984 |
| Linn | 20,378 | 39.63% | 28,944 | 56.28% | 2,104 | 4.09% | -8,566 | -16.65% | 51,426 |
| Malheur | 2,759 | 27.71% | 6,851 | 68.81% | 346 | 3.48% | -4,092 | -41.10% | 9,956 |
| Marion | 56,376 | 46.83% | 60,190 | 50.00% | 3,810 | 3.17% | -3,814 | -3.17% | 120,376 |
| Morrow | 1,202 | 30.96% | 2,532 | 65.22% | 148 | 3.82% | -1,330 | -34.26% | 3,882 |
| Multnomah | 274,887 | 75.37% | 75,302 | 20.65% | 14,533 | 3.98% | 199,585 | 54.72% | 364,722 |
| Polk | 16,292 | 46.21% | 17,819 | 50.54% | 1,146 | 3.25% | -1,527 | -4.33% | 35,257 |
| Sherman | 319 | 31.09% | 678 | 66.08% | 29 | 2.83% | -359 | -34.99% | 1,026 |
| Tillamook | 6,293 | 50.27% | 5,684 | 45.40% | 542 | 4.33% | 609 | 4.87% | 12,519 |
| Umatilla | 8,584 | 34.38% | 15,499 | 62.07% | 886 | 3.55% | -6,915 | -27.69% | 24,969 |
| Union | 3,973 | 32.92% | 7,636 | 63.26% | 461 | 3.82% | -3,663 | -30.34% | 12,070 |
| Wallowa | 1,253 | 29.80% | 2,804 | 66.68% | 148 | 3.52% | -1,551 | -36.88% | 4,205 |
| Wasco | 5,211 | 47.93% | 5,229 | 48.09% | 433 | 3.98% | -18 | -0.16% | 10,873 |
| Washington | 135,291 | 57.08% | 93,974 | 39.65% | 7,758 | 3.27% | 41,317 | 17.43% | 237,023 |
| Wheeler | 266 | 31.00% | 545 | 63.52% | 47 | 5.48% | -279 | -32.52% | 858 |
| Yamhill | 19,260 | 44.89% | 22,045 | 51.38% | 1,602 | 3.73% | -2,785 | -6.49% | 42,907 |
| Total | 970,488 | 54.24% | 754,175 | 42.15% | 64,607 | 3.61% | 216,313 | 12.09% | 1,789,270 |

|
Democratic
Hold |
Republican
Hold
Gain from Democratic
|
Counties that flipped from Democratic to Republican
Results by congressional districts
Obama won 4 of 5 congressional districts.[8]
| District | Obama | Romney | Representative |
|---|---|---|---|
| 1st | 57.28% | 40.01% | Suzanne Bonamici |
| 2nd | 40.46% | 56.83% | Greg Walden |
| 3rd | 72.03% | 24.68% | Earl Blumenauer |
| 4th | 51.74% | 44.98% | Peter DeFazio |
| 5th | 50.49% | 47.11% | Kurt Schrader |
See also
References
- ↑ "Oregon - Election Results 2008 - The New York Times". www.nytimes.com. Retrieved November 9, 2020.
- 1 2 "May 15, 2012, Primary Election Abstracts of Votes: United States President". Oregon Elections Division. Retrieved December 5, 2012.
- ↑ "Primary and Caucus Printable Calendar". CNN. Retrieved January 12, 2012.
- ↑ "Presidential Primary Dates" (PDF). Federal Election Commission. Retrieved January 23, 2012.
- ↑ Mickler, Lauren (March 6, 2012). "Oregon Primary Two Months Away". Eugene, OR: KEZI 9 News.
- ↑ Mapes, Jeff (February 6, 2012). "Oregon Republican Party opens three statewide primaries to non-affiliated voters". The Oregonian.
- ↑ "Official Results November 6, 2012 General Election". Oregon Secretary of State. Retrieved September 19, 2016.
- ↑ "Daily Kos Elections' statewide election results by congressional and legislative districts". Daily Kos. Retrieved August 11, 2020.
External links
- The Green Papers: for Oregon
- The Green Papers: major state elections in chronological order


.jpg.webp)

.jpg.webp)
