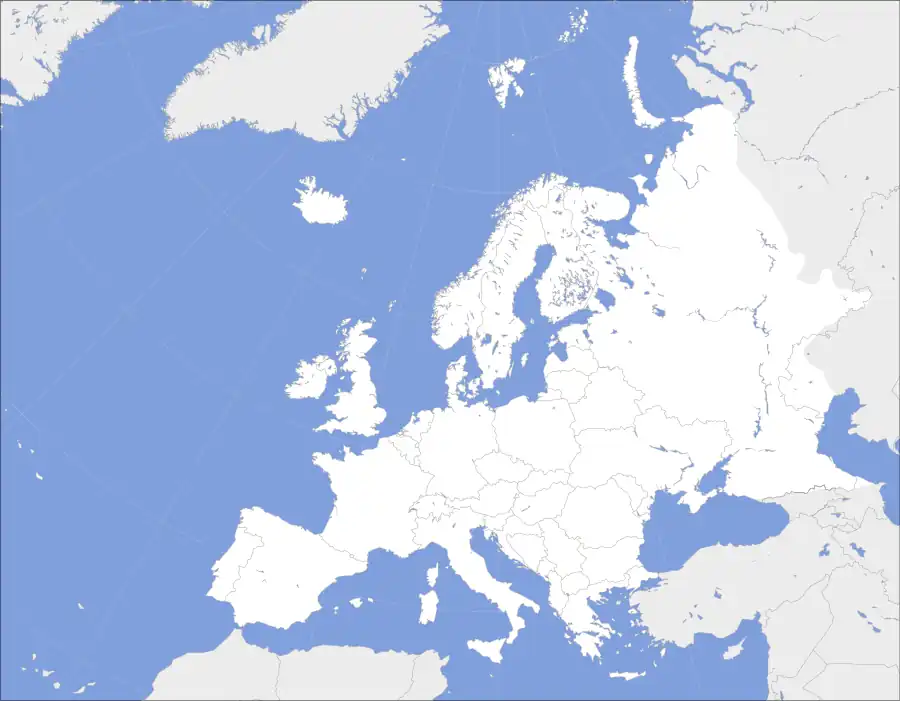
Map
The map data is from year 2013, where data is available, from the World Bank.[1] Numbers are in percentage.
Table
The table uses an interval of years from the World Bank.[2] Numbers are in percentage.
| Country | 2010 | 2011 | 2012 | 2013 | 2014 | 2015 |
|---|---|---|---|---|---|---|
| 63.239 | 61.503 | 57.754 | 56.395 | 61.422 | ||
| 70.267 | 69.154 | 67.303 | 66.254 | 64.813 | 65.662 | |
| 91.996 | 91.392 | 91.047 | 90.672 | 92.440 | ||
| 72.794 | 70.254 | 71.116 | 70.820 | 72.653 | 75.871 | |
| 91.653 | 93.997 | 91.948 | 92.504 | 77.522 | ||
| 73.165 | 75.044 | 72.187 | 70.208 | 71.046 | ||
| 74.295 | 74.637 | 72.238 | 71.303 | 70.704 | ||
| 95.391 | 94.894 | 94.166 | 92.991 | 92.906 | ||
| 80.560 | 79.287 | 77.201 | 77.182 | 75.279 | 77.735 | |
| 78.274 | 74.822 | 70.862 | 70.259 | 67.705 | 64.927 | |
| 20.575 | 18.878 | 19.560 | 17.199 | 14.490 | 13.056 | |
| 48.800 | 46.989 | 43.033 | 42.627 | 42.183 | 40.208 | |
| 49.836 | 48.677 | 49.012 | 48.544 | 46.226 | 46.488 | |
| 79.560 | 80.370 | 80.625 | 81.088 | 79.711 | 78.863 | |
| 90.386 | 90.853 | 90.148 | 88.001 | 86.049 | 82.575 | |
| 74.272 | 73.294 | 71.786 | 69.550 | 68.192 | 69.550 | |
| 11.520 | 10.255 | 10.331 | 10.404 | 10.928 | 11.289 | |
| 90.003 | 88.322 | 86.856 | 86.278 | 84.438 | 85.343 | |
| 84.629 | 84.465 | 82.201 | 79.964 | 78.586 | 79.948 | |
| 65.850 | 62.894 | 58.042 | 58.924 | 56.717 | ||
| 74.298 | 73.876 | 72.893 | 70.022 | 67.994 | ||
| 87.957 | 87.009 | 87.216 | 84.506 | 83.332 | 80.562 | |
| 81.119 | 82.109 | 82.131 | 81.143 | 79.426 | ||
| 99.672 | 99.238 | 99.038 | 98.758 | 97.788 | ||
| 62.083 | 63.246 | 61.200 | 63.869 | 64.665 | ||
| 93.675 | 92.186 | 91.234 | 91.554 | 90.922 | 93.461 | |
| 63.043 | 57.322 | 57.807 | 61.840 | 57.978 | 56.952 | |
| 92.451 | 92.115 | 90.979 | 91.146 | 90.088 | 90.291 | |
| 75.126 | 75.657 | 75.812 | 73.350 | 72.813 | 77.024 | |
| 75.071 | 77.652 | 76.427 | 73.494 | 72.524 | ||
| 90.530 | 90.908 | 90.866 | 89.512 | 92.143 | ||
| 86.942 | 89.074 | 87.089 | 88.486 | 83.871 | ||
| 66.679 | 64.935 | 65.082 | 63.749 | 59.663 | 61.114 | |
| 76.001 | 76.500 | 75.008 | 72.551 | 71.531 | 72.956 | |
| 34.423 | 34.214 | 30.999 | 30.016 | 29.775 | 25.117 | |
| 51.554 | 50.389 | 50.917 | 52.106 | 48.742 | 50.168 | |
| 89.124 | 89.969 | 89.411 | 88.157 | 89.544 | 86.843 | |
| 80.454 | 79.554 | 79.258 | 78.232 | 75.350 | ||
| 88.168 | 85.563 | 85.140 | 83.560 | 82.717 | 80.352 | |
See also
Plotted maps
- European countries by electricity consumption per person
- European countries by employment in agriculture (% of employed)
- European countries by health expense per person
- European countries by military expenditure as a percentage of government expenditure
- European countries by percent of population aged 0-14
- European countries by percentage of urban population
- European countries by percentage of women in national parliaments
- List of sovereign states in Europe by life expectancy
- List of sovereign states in Europe by number of Internet users
References
- ↑ "Fossil fuel energy consumption (% of total)". The World Bank. Retrieved 11 August 2015.
- ↑ "Fossil fuel energy consumption (% of total)". The World Bank. Retrieved 11 August 2019.
External links
This article is issued from Wikipedia. The text is licensed under Creative Commons - Attribution - Sharealike. Additional terms may apply for the media files.
