This is a list of European countries by life expectancy at birth.
World Bank Group (2021)
Estimation of the World Bank Group for 2021.[1][2][3] The data is filtered according to the list of countries in Europe. In the World Bank Group list and, accordingly, in this list, there are no mini-states with a population of several tens of thousands of people (Andorra, Monaco, San Marino, Vatican City). The values in the World Bank Group tables are rounded. All calculations are based on raw data, so due to the nuances of rounding, in some places, illusory inconsistencies of indicators arose, with a size of 0.01 year.
| Countries & territories |
2021 | Historical data | COVID-19 impact | |||||||||||||
|---|---|---|---|---|---|---|---|---|---|---|---|---|---|---|---|---|
| All | Male | Female | Gender gap |
2000 | 2000 →2014 |
2014 | 2014 →2019 |
2019 | 2019 →2020 |
2020 | 2020 →2021 |
2021 | 2019 →2021 |
2014 →2021 | ||
| 84.40 | 82.50 | 86.40 | 3.90 | 76.83 | 5.25 | 82.07 | 2.09 | 84.16 | −2.50 | 81.66 | 2.74 | 84.40 | 0.24 | 2.33 | ||
| 83.85 | 81.90 | 85.90 | 4.00 | 79.68 | 3.52 | 83.20 | 0.71 | 83.90 | −0.90 | 83.00 | 0.85 | 83.85 | −0.05 | 0.65 | ||
| 83.50 | 81.40 | 85.70 | 4.30 | 78.44 | 3.16 | 81.59 | 1.35 | 82.95 | 0.25 | 83.20 | 0.30 | 83.50 | 0.55 | 1.90 | ||
| 83.18 | 80.30 | 86.20 | 5.90 | 78.97 | 4.26 | 83.23 | 0.60 | 83.83 | −1.50 | 82.33 | 0.85 | 83.18 | −0.65 | −0.05 | ||
| 83.16 | 81.70 | 84.70 | 3.00 | 78.63 | 3.47 | 82.10 | 0.86 | 82.96 | 0.25 | 83.21 | −0.05 | 83.16 | 0.20 | 1.06 | ||
| 83.16 | 81.40 | 85.00 | 3.60 | 79.64 | 2.61 | 82.25 | 0.86 | 83.11 | −0.75 | 82.36 | 0.80 | 83.16 | 0.05 | 0.90 | ||
| 83.12 | 81.80 | 84.50 | 2.70 | 79.65 | 3.21 | 82.86 | 0.30 | 83.16 | −0.10 | 83.06 | 0.05 | 83.12 | −0.05 | 0.26 | ||
| 82.86 | 81.30 | 84.50 | 3.20 | 78.35 | 3.70 | 82.05 | 0.81 | 82.86 | −0.51 | 82.35 | 0.51 | 82.86 | 0.00 | 0.81 | ||
| 82.80 | 80.60 | 85.10 | 4.50 | 79.78 | 3.31 | 83.09 | 0.41 | 83.50 | −1.30 | 82.20 | 0.60 | 82.80 | −0.70 | −0.30 | ||
| 82.75 | 80.70 | 84.90 | 4.20 | 77.87 | 4.36 | 82.23 | 0.41 | 82.64 | −0.50 | 82.14 | 0.60 | 82.75 | 0.11 | 0.52 | ||
| 82.32 | 79.30 | 85.50 | 6.20 | 79.06 | 3.66 | 82.72 | 0.11 | 82.83 | −0.65 | 82.18 | 0.15 | 82.32 | −0.50 | −0.40 | ||
| 82.10 | 80.20 | 84.10 | 3.90 | 76.54 | 4.81 | 81.35 | 1.35 | 82.70 | −0.15 | 82.56 | −0.45 | 82.10 | −0.60 | 0.75 | ||
| 81.93 | 79.30 | 84.70 | 5.40 | 77.47 | 3.71 | 81.18 | 0.80 | 81.98 | −0.05 | 81.93 | 0.00 | 81.93 | −0.05 | 0.75 | ||
| 81.89 | 79.50 | 84.40 | 4.90 | 77.72 | 3.57 | 81.29 | 0.71 | 82.00 | −1.30 | 80.70 | 1.20 | 81.89 | −0.10 | 0.60 | ||
| 81.46 | 79.90 | 83.10 | 3.20 | 77.99 | 3.72 | 81.71 | 0.40 | 82.11 | −0.75 | 81.36 | 0.10 | 81.46 | −0.65 | −0.25 | ||
| 81.40 | 79.60 | 83.30 | 3.70 | 76.59 | 4.11 | 80.70 | 0.75 | 81.45 | 0.15 | 81.60 | −0.20 | 81.40 | −0.05 | 0.70 | ||
| 81.24 | 78.80 | 83.80 | 5.00 | 78.13 | 3.36 | 81.49 | 0.40 | 81.90 | −0.70 | 81.19 | 0.05 | 81.24 | −0.66 | −0.25 | ||
| 81.23 | 79.11 | 83.36 | 4.24 | 79.16 | 2.73 | 81.88 | −0.49 | 81.39 | −0.13 | 81.26 | −0.03 | 81.23 | −0.16 | −0.65 | ||
| 81.20 | 79.21 | 83.20 | 3.99 | 76.57 | 4.20 | 80.77 | 0.63 | 81.40 | −0.01 | 81.39 | −0.19 | 81.20 | −0.19 | 0.43 | ||
| 81.07 | 78.00 | 84.30 | 6.30 | 76.31 | 4.81 | 81.12 | 0.55 | 81.68 | −0.70 | 80.98 | 0.10 | 81.07 | −0.60 | −0.05 | ||
| 80.90 | 78.54 | 83.38 | 4.84 | 77.93 | 3.16 | 81.09 | 0.20 | 81.29 | −0.25 | 81.04 | −0.14 | 80.90 | −0.39 | −0.19 | ||
| 80.88 | 77.90 | 84.00 | 6.10 | 75.41 | 5.67 | 81.08 | 0.45 | 81.53 | −1.00 | 80.53 | 0.34 | 80.88 | −0.65 | −0.20 | ||
| 80.70 | 78.70 | 82.80 | 4.10 | 77.74 | 3.56 | 81.30 | 0.10 | 81.40 | −1.05 | 80.35 | 0.35 | 80.70 | −0.70 | −0.60 | ||
| 80.53 | 78.56 | 82.53 | 3.97 | 74.72 | 5.31 | 80.04 | 0.70 | 80.74 | −0.15 | 80.59 | −0.06 | 80.53 | −0.21 | 0.49 | ||
| 80.18 | 77.50 | 83.00 | 5.50 | 77.89 | 3.50 | 81.39 | 0.25 | 81.64 | −0.35 | 81.29 | −1.10 | 80.18 | −1.46 | −1.20 | ||
| 79.33 | 77.11 | 81.70 | 4.59 | 81.37 | 0.51 | 81.88 | 0.48 | 82.36 | −0.17 | 82.20 | −2.87 | 79.33 | −3.03 | −2.55 | ||
| 77.37 | 74.30 | 80.60 | 6.30 | 74.97 | 3.86 | 78.82 | 0.40 | 79.23 | −1.00 | 78.23 | −0.85 | 77.37 | −1.86 | −1.45 | ||
| 76.74 | 72.40 | 81.30 | 8.90 | 70.42 | 6.62 | 77.03 | 1.61 | 78.65 | −0.05 | 78.60 | −1.85 | 76.74 | −1.90 | −0.29 | ||
| 76.46 | 74.09 | 79.17 | 5.09 | 75.40 | 3.00 | 78.41 | 0.88 | 79.28 | −2.29 | 76.99 | −0.53 | 76.46 | −2.82 | −1.94 | ||
| 76.42 | 73.40 | 79.60 | 6.20 | 72.81 | 4.67 | 77.48 | 0.95 | 78.42 | −0.70 | 77.72 | −1.30 | 76.42 | −2.00 | −1.05 | ||
| 76.03 | 73.04 | 79.12 | 6.08 | 71.86 | 4.70 | 76.56 | 1.27 | 77.83 | −1.98 | 75.85 | 0.18 | 76.03 | −1.80 | −0.53 | ||
| 75.60 | 71.70 | 79.70 | 8.00 | 73.75 | 3.85 | 77.60 | 0.30 | 77.90 | −1.40 | 76.50 | −0.90 | 75.60 | −2.30 | −2.00 | ||
| 75.30 | 73.11 | 77.53 | 4.42 | 74.50 | 1.16 | 75.66 | 1.58 | 77.24 | −1.02 | 76.22 | −0.92 | 75.30 | −1.94 | −0.36 | ||
| 74.71 | 71.30 | 78.30 | 7.00 | 73.05 | 3.76 | 76.81 | 0.85 | 77.67 | −0.80 | 76.87 | −2.15 | 74.71 | −2.95 | −2.10 | ||
| 74.54 | 72.41 | 76.77 | 4.36 | 72.95 | 2.50 | 75.45 | 1.15 | 76.60 | −2.21 | 74.40 | 0.14 | 74.54 | −2.07 | −0.91 | ||
| 74.47 | 71.10 | 78.00 | 6.90 | 71.25 | 4.52 | 75.76 | 0.56 | 76.32 | −0.75 | 75.57 | −1.10 | 74.47 | −1.85 | −1.30 | ||
| 74.34 | 69.90 | 79.00 | 9.10 | 72.02 | 2.50 | 74.52 | 1.77 | 76.28 | −1.30 | 74.98 | −0.64 | 74.34 | −1.94 | −0.18 | ||
| 73.82 | 70.80 | 77.00 | 6.20 | 73.82 | 2.62 | 76.44 | 0.24 | 76.68 | −0.75 | 75.93 | −2.11 | 73.82 | −2.86 | −2.62 | ||
| 73.28 | 68.60 | 78.20 | 9.60 | 70.31 | 3.81 | 74.12 | 1.26 | 75.39 | −0.20 | 75.19 | −1.90 | 73.28 | −2.10 | −0.84 | ||
| 72.96 | 69.40 | 76.70 | 7.30 | 71.16 | 3.75 | 74.91 | 0.70 | 75.61 | −1.35 | 74.25 | −1.29 | 72.96 | −2.65 | −1.95 | ||
| 72.73 | 69.96 | 75.64 | 5.68 | 71.58 | 3.75 | 75.34 | 0.60 | 75.94 | −1.46 | 74.48 | −1.75 | 72.73 | −3.21 | −2.61 | ||
| 72.37 | 67.30 | 77.70 | 10.40 | 68.91 | 4.06 | 72.97 | 1.26 | 74.23 | −1.77 | 72.46 | −0.09 | 72.37 | −1.86 | −0.60 | ||
| 72.04 | 66.55 | 77.35 | 10.80 | 70.62 | 3.43 | 74.06 | 1.38 | 75.44 | −3.27 | 72.17 | −0.13 | 72.04 | −3.40 | −2.02 | ||
| 71.69 | 66.80 | 76.68 | 9.88 | 69.58 | 3.52 | 73.10 | 0.37 | 73.47 | −0.70 | 72.77 | −1.07 | 71.69 | −1.78 | −1.41 | ||
| 71.51 | 68.10 | 75.10 | 7.00 | 71.66 | 2.80 | 74.47 | 0.65 | 75.11 | −1.45 | 73.66 | −2.14 | 71.51 | −3.60 | −2.95 | ||
| World | 71.33 | 68.89 | 73.95 | 5.06 | 67.70 | 4.18 | 71.88 | 1.10 | 72.98 | −0.74 | 72.24 | −0.92 | 71.33 | −1.65 | −0.55 | |
| 70.23 | 66.33 | 74.03 | 7.70 | 65.45 | 5.99 | 71.44 | 1.74 | 73.18 | −1.81 | 71.37 | −1.14 | 70.23 | −2.95 | −1.21 | ||
| 69.65 | 65.16 | 74.36 | 9.20 | 67.68 | 3.51 | 71.19 | 0.64 | 71.83 | −0.64 | 71.19 | −1.54 | 69.65 | −2.18 | −1.54 | ||
| 69.37 | 65.65 | 73.29 | 7.64 | 64.89 | 6.22 | 71.12 | 1.99 | 73.10 | −6.23 | 66.87 | 2.50 | 69.37 | −3.74 | −1.75 | ||
| 69.36 | 64.21 | 74.77 | 10.56 | 65.48 | 5.26 | 70.74 | 2.34 | 73.08 | −1.75 | 71.34 | −1.98 | 69.36 | −3.72 | −1.38 | ||
| 68.85 | 64.44 | 73.55 | 9.10 | 66.42 | 2.61 | 69.03 | 1.90 | 70.94 | −0.77 | 70.17 | −1.32 | 68.85 | −2.09 | −0.19 | ||

United Nations (2021)
Estimation of the analytical agency of the UN for 2019 and 2021.[4][5][6] By default, the list is sorted by 2021.

| Countries & territories |
2019 | 2021 | 2019 →2021 | ||||||
|---|---|---|---|---|---|---|---|---|---|
| All | Male | Female | Gender gap |
All | Male | Female | Gender gap | ||
| — | — | — | — | 85.9 | 84.3 | 87.7 | 3.4 | ||
| 83.8 | 81.9 | 85.6 | 3.7 | 84.0 | 82.0 | 85.9 | 3.9 | 0.2 | |
| 82.5 | 80.7 | 84.3 | 3.6 | 83.8 | 81.4 | 86.1 | 4.7 | 1.3 | |
| 80.7 | — | — | — | 83.3 | 81.1 | 85.4 | 4.3 | 2.6 | |
| 82.4 | 80.4 | 84.4 | 4.0 | 83.2 | 81.6 | 84.9 | 3.3 | 0.8 | |
| 82.8 | 81.0 | 84.6 | 3.6 | 83.0 | 81.1 | 84.9 | 3.8 | 0.2 | |
| 83.6 | 80.8 | 86.2 | 5.4 | 83.0 | 80.2 | 85.8 | 5.6 | −0.6 | |
| 83.5 | 81.3 | 85.5 | 4.2 | 82.9 | 80.5 | 85.1 | 4.6 | −0.6 | |
| 83.0 | 81.5 | 84.5 | 3.0 | 82.7 | 81.2 | 84.2 | 3.0 | −0.3 | |
| 82.3 | 80.2 | 84.3 | 4.1 | 82.6 | 80.4 | 84.8 | 4.4 | 0.3 | |
| 82.7 | 79.7 | 85.5 | 5.8 | 82.5 | 79.4 | 85.5 | 6.1 | −0.2 | |
| 82.3 | 80.7 | 83.9 | 3.2 | 82.0 | 80.2 | 83.8 | 3.6 | −0.3 | |
| 81.9 | 79.1 | 84.7 | 5.6 | 82.0 | 79.3 | 84.7 | 5.4 | 0.1 | |
| 81.6 | 79.3 | 83.9 | 4.6 | 81.9 | 79.4 | 84.3 | 4.9 | 0.3 | |
| 82.3 | 80.6 | 84.0 | 3.4 | 81.7 | 80.0 | 83.4 | 3.4 | −0.6 | |
| 81.5 | 79.2 | 83.9 | 4.7 | 81.6 | 79.0 | 84.1 | 5.1 | 0.1 | |
| 80.9 | 78.9 | 82.9 | 4.0 | 81.4 | 79.5 | 83.3 | 3.8 | 0.5 | |
| 81.0 | 78.9 | 83.0 | 4.1 | 81.2 | 79.2 | 83.2 | 4.0 | 0.2 | |
| 82.1 | 79.0 | 84.9 | 5.9 | 81.0 | 77.8 | 84.1 | 6.3 | −1.1 | |
| — | — | — | — | 80.9 | 78.4 | 83.5 | 5.1 | ||
| 81.3 | 79.6 | 83.0 | 3.4 | 80.7 | 78.7 | 82.8 | 4.1 | −0.6 | |
| 81.3 | 78.6 | 84.0 | 5.4 | 80.7 | 77.6 | 83.8 | 6.2 | −0.6 | |
| 81.3 | 78.9 | 83.7 | 4.8 | 80.6 | 78.1 | 83.2 | 5.1 | −0.7 | |
| 81.9 | — | — | — | 80.4 | 77.2 | 84.3 | 7.1 | −1.5 | |
| 82.2 | 79.8 | 84.7 | 4.9 | 80.1 | 77.5 | 82.9 | 5.4 | −2.1 | |
| 79.4 | 76.8 | 81.9 | 5.1 | 77.7 | 74.7 | 80.9 | 6.2 | −1.7 | |
| 78.5 | 75.3 | 81.6 | 6.3 | 77.6 | 74.2 | 81.1 | 6.9 | −0.9 | |
| 78.8 | 74.4 | 82.7 | 8.3 | 77.1 | 72.8 | 81.2 | 8.4 | −1.7 | |
| 78.6 | 77.0 | 80.2 | 3.2 | 76.5 | 74.1 | 79.2 | 5.1 | −2.1 | |
| 78.7 | 74.8 | 82.6 | 7.8 | 76.5 | 72.6 | 80.4 | 7.8 | −2.2 | |
| 76.9 | 74.4 | 79.3 | 4.9 | 76.3 | 73.0 | 79.8 | 6.8 | −0.6 | |
| 77.7 | 74.7 | 80.6 | 5.9 | 76.0 | 73.0 | 79.1 | 6.1 | −1.7 | |
| 77.4 | 74.9 | 79.9 | 5.0 | 75.3 | 73.1 | 77.5 | 4.4 | −2.1 | |
| 77.5 | 74.0 | 81.0 | 7.0 | 74.9 | 71.5 | 78.4 | 6.9 | −2.6 | |
| 76.9 | 73.2 | 80.3 | 7.1 | 74.5 | 71.1 | 77.9 | 6.8 | −2.4 | |
| 76.0 | 73.4 | 78.6 | 5.2 | 74.2 | 71.2 | 77.2 | 6.0 | −1.8 | |
| 76.1 | 72.6 | 79.5 | 6.9 | 74.2 | 70.6 | 77.9 | 7.3 | −1.9 | |
| 75.8 | 73.8 | 77.8 | 4.0 | 73.8 | 71.7 | 76.2 | 4.5 | −2.0 | |
| 75.9 | 70.3 | 81.4 | 11.1 | 73.7 | 68.8 | 78.8 | 10.0 | −2.2 | |
| 75.3 | 70.2 | 80.0 | 9.8 | 73.6 | 69.2 | 77.8 | 8.6 | −1.7 | |
| 74.8 | 69.7 | 79.6 | 9.9 | 72.4 | 67.3 | 77.7 | 10.4 | −2.4 | |
| 75.1 | 71.3 | 78.5 | 7.2 | 72.0 | 66.6 | 77.4 | 10.8 | −3.1 | |
| 75.1 | 71.6 | 78.7 | 7.1 | 71.8 | 68.4 | 75.5 | 7.1 | −3.3 | |
| 73.8 | 69.3 | 78.1 | 8.8 | 71.7 | 66.8 | 76.7 | 9.9 | −2.1 | |
| 72.1 | 67.1 | 76.8 | 9.7 | 71.6 | 66.5 | 76.7 | 10.2 | −0.5 | |
| World | 72.8 | 70.6 | 75.0 | 4.4 | 71.4 | 68.9 | 74.0 | 5.1 | −1.4 |
| 73.0 | 70.5 | 75.5 | 5.0 | 69.4 | 65.6 | 73.3 | 7.7 | −3.6 | |
| 73.6 | 69.2 | 77.7 | 8.5 | 69.4 | 65.5 | 73.1 | 7.6 | −4.2 | |
| 72.6 | 67.1 | 77.8 | 10.7 | 69.4 | 64.2 | 74.8 | 10.6 | −3.2 | |
| 71.9 | 67.6 | 76.2 | 8.6 | 68.8 | 64.4 | 73.5 | 9.1 | −3.1 | |
WHO (2019)
List of countries by life expectancy for 2019 according to the World Health Organization.[7][8] The data is filtered according to the list of countries in Europe. In the WHO list and, accordingly, in this list, there are no mini-states with a population of several tens of thousands of people (Andorra, Liechtenstein, Monaco, San Marino, Vatican City).
| Countries | Life expectancy at birth | HALE at birth | Life expectancy at age 60 | HALE at age 60 | |||||||||||||||||
|---|---|---|---|---|---|---|---|---|---|---|---|---|---|---|---|---|---|---|---|---|---|
| All | M | F | FΔM | Δ 2000 |
All | M | F | FΔM | Δ 2000 |
All | M | F | FΔM | Δ 2000 |
All | M | F | FΔM | Δ 2000 | ||
| 83.4 | 81.8 | 85.1 | 3.3 | 3.7 | 72.5 | 72.2 | 72.8 | 0.6 | 3.2 | 25.4 | 24.1 | 26.6 | 2.5 | 2.4 | 19.5 | 18.8 | 20.2 | 1.4 | 1.8 | ||
| 83.2 | 80.7 | 85.7 | 5.0 | 4.1 | 72.1 | 71.3 | 72.9 | 1.6 | 3.0 | 25.4 | 23.3 | 27.3 | 4.0 | 2.7 | 19.2 | 18.0 | 20.3 | 2.3 | 1.9 | ||
| 83.1 | 81.1 | 85.1 | 4.0 | 4.4 | 72.4 | 71.8 | 73.0 | 1.2 | 3.3 | 24.9 | 23.3 | 26.4 | 3.1 | 3.0 | 19.0 | 18.1 | 19.9 | 1.8 | 2.2 | ||
| 83.0 | 80.9 | 84.9 | 4.0 | 3.6 | 71.9 | 71.2 | 72.6 | 1.4 | 2.9 | 25.0 | 23.4 | 26.5 | 3.1 | 2.5 | 18.9 | 17.9 | 19.8 | 1.9 | 1.8 | ||
| 82.6 | 81.1 | 84.1 | 3.0 | 4.1 | 71.4 | 71.0 | 71.6 | 0.6 | 3.0 | 24.7 | 23.5 | 25.8 | 2.3 | 2.7 | 18.5 | 17.8 | 19.1 | 1.3 | 1.8 | ||
| 82.5 | 79.8 | 85.1 | 5.3 | 3.6 | 72.1 | 71.1 | 73.1 | 2.0 | 2.8 | 25.3 | 23.3 | 27.2 | 3.9 | 2.3 | 19.7 | 18.5 | 20.8 | 2.3 | 1.7 | ||
| 82.4 | 80.8 | 84.0 | 3.2 | 2.8 | 71.9 | 71.7 | 72.1 | 0.4 | 2.0 | 24.5 | 23.3 | 25.6 | 2.3 | 2.1 | 18.9 | 18.3 | 19.4 | 1.1 | 1.5 | ||
| 82.4 | 80.6 | 84.2 | 3.6 | 4.2 | 71.6 | 71.1 | 72.0 | 0.9 | 3.3 | 24.4 | 22.9 | 25.8 | 2.9 | 2.6 | 18.5 | 17.7 | 19.3 | 1.6 | 1.8 | ||
| 82.3 | 80.8 | 83.9 | 3.1 | 2.6 | 72.0 | 71.7 | 72.3 | 0.6 | 2.2 | 24.6 | 23.7 | 25.5 | 1.8 | 2.0 | 19.0 | 18.6 | 19.4 | 0.8 | 1.6 | ||
| 81.9 | 79.9 | 83.8 | 3.9 | 4.0 | 71.5 | 70.9 | 71.9 | 1.0 | 3.0 | 24.5 | 23.0 | 25.9 | 2.9 | 3.7 | 18.9 | 18.0 | 19.6 | 1.6 | 2.7 | ||
| 81.8 | 80.4 | 83.1 | 2.7 | 3.8 | 71.4 | 71.3 | 71.5 | 0.2 | 2.6 | 24.1 | 23.0 | 25.1 | 2.1 | 2.8 | 18.4 | 17.9 | 18.9 | 1.0 | 1.8 | ||
| 81.8 | 80.2 | 83.5 | 3.3 | 5.4 | 71.1 | 70.7 | 71.4 | 0.7 | 4.0 | 24.2 | 23.0 | 25.3 | 2.3 | 4.0 | 18.6 | 18.0 | 19.2 | 1.2 | 2.9 | ||
| 81.7 | 78.7 | 84.8 | 6.1 | 3.6 | 70.9 | 69.7 | 72.1 | 2.4 | 2.4 | 24.4 | 21.9 | 26.9 | 5.0 | 2.6 | 18.5 | 17.0 | 19.9 | 2.9 | 1.7 | ||
| 81.6 | 78.6 | 84.4 | 5.8 | 5.0 | 71.0 | 69.6 | 72.2 | 2.6 | 4.2 | 24.3 | 22.1 | 26.3 | 4.2 | 3.1 | 18.6 | 17.3 | 19.8 | 2.5 | 2.3 | ||
| 81.6 | 79.2 | 84.0 | 4.8 | 4.0 | 71.0 | 69.9 | 72.0 | 2.1 | 3.2 | 24.2 | 22.4 | 25.8 | 3.4 | 2.6 | 18.5 | 17.3 | 19.5 | 2.2 | 2.0 | ||
| 81.6 | 79.4 | 83.8 | 4.4 | 3.4 | 70.9 | 69.9 | 71.9 | 2.0 | 2.7 | 24.1 | 22.4 | 25.6 | 3.2 | 2.1 | 18.3 | 17.2 | 19.4 | 2.2 | 1.6 | ||
| 81.4 | 79.3 | 83.5 | 4.2 | 3.7 | 70.6 | 69.8 | 71.3 | 1.5 | 2.8 | 24.0 | 22.3 | 25.6 | 3.3 | 2.4 | 18.2 | 17.2 | 19.1 | 1.9 | 1.6 | ||
| 81.4 | 79.8 | 83.0 | 3.2 | 3.5 | 70.1 | 69.6 | 70.6 | 1.0 | 2.5 | 24.1 | 23.0 | 25.2 | 2.2 | 2.8 | 18.3 | 17.6 | 18.9 | 1.3 | 2.0 | ||
| 81.3 | 79.6 | 83.0 | 3.4 | 4.4 | 71.0 | 70.7 | 71.4 | 0.7 | 3.4 | 23.6 | 22.3 | 24.9 | 2.6 | 3.0 | 18.2 | 17.6 | 18.9 | 1.3 | 2.2 | ||
| 81.3 | 78.6 | 84.1 | 5.5 | 5.2 | 70.7 | 69.0 | 72.5 | 3.5 | 4.2 | 23.8 | 21.8 | 25.6 | 3.8 | 3.3 | 17.8 | 16.4 | 19.2 | 2.8 | 2.5 | ||
| 81.1 | 78.6 | 83.6 | 5.0 | 2.9 | 70.9 | 69.9 | 71.9 | 2.0 | 2.3 | 23.8 | 22.1 | 25.5 | 3.4 | 2.3 | 18.4 | 17.3 | 19.5 | 2.2 | 1.6 | ||
| 79.1 | 76.3 | 81.9 | 5.6 | 4.1 | 68.8 | 67.0 | 70.6 | 3.6 | 2.9 | 22.1 | 19.9 | 24.0 | 4.1 | 2.8 | 16.3 | 14.7 | 17.8 | 3.1 | 1.7 | ||
| 78.9 | 74.7 | 82.6 | 7.9 | 8.0 | 69.2 | 66.4 | 71.7 | 5.3 | 6.6 | 22.5 | 19.3 | 25.0 | 5.7 | 3.9 | 17.3 | 14.8 | 19.1 | 4.3 | 3.0 | ||
| 78.6 | 75.5 | 81.6 | 6.1 | 4.2 | 68.6 | 66.7 | 70.5 | 3.8 | 3.2 | 21.8 | 19.4 | 23.7 | 4.3 | 2.8 | 16.2 | 14.6 | 17.7 | 3.1 | 1.8 | ||
| 78.6 | 76.4 | 80.7 | 4.3 | 4.2 | 68.4 | 67.8 | 69.0 | 1.2 | 3.4 | 22.0 | 20.6 | 23.2 | 2.6 | 0.5 | 16.6 | 15.8 | 17.3 | 1.5 | 0.3 | ||
| 78.3 | 74.5 | 81.9 | 7.4 | 4.6 | 68.7 | 65.9 | 71.3 | 5.4 | 3.7 | 22.1 | 19.5 | 24.3 | 4.8 | 2.9 | 16.8 | 14.9 | 18.5 | 3.6 | 2.1 | ||
| 78.2 | 74.8 | 81.4 | 6.6 | 4.9 | 68.5 | 66.2 | 70.8 | 4.6 | 3.8 | 21.8 | 19.3 | 23.9 | 4.6 | 3.3 | 16.6 | 14.6 | 18.2 | 3.6 | 2.4 | ||
| Europe[9] | 78.2 | 75.1 | 81.3 | 6.2 | 5.7 | 68.3 | 66.6 | 70.0 | 3.4 | 4.6 | 22.5 | 20.5 | 24.3 | 3.8 | 2.9 | 17.1 | 15.8 | 18.3 | 2.5 | 2.1 | |
| 78.0 | 76.3 | 79.9 | 3.6 | 4.5 | 69.1 | 68.0 | 70.3 | 2.3 | 3.9 | 21.0 | 20.2 | 21.9 | 1.7 | 2.0 | 16.6 | 15.9 | 17.3 | 1.4 | 1.6 | ||
| 76.8 | 74.4 | 79.1 | 4.7 | 1.4 | 67.2 | 65.7 | 68.7 | 3.0 | 1.0 | 20.2 | 18.6 | 21.6 | 3.0 | 0.6 | 15.2 | 14.1 | 16.2 | 2.1 | 0.2 | ||
| 76.4 | 73.1 | 79.6 | 6.5 | 5.1 | 67.2 | 65.0 | 69.3 | 4.3 | 4.2 | 20.2 | 17.7 | 22.3 | 4.6 | 2.2 | 15.3 | 13.4 | 16.8 | 3.4 | 1.7 | ||
| 76.0 | 72.5 | 79.2 | 6.7 | 4.1 | 67.1 | 64.9 | 69.1 | 4.2 | 3.6 | 20.4 | 18.2 | 22.1 | 3.9 | 1.6 | 15.7 | 14.2 | 16.9 | 2.7 | 1.2 | ||
| 76.0 | 71.2 | 80.4 | 9.2 | 4.0 | 66.7 | 63.4 | 69.7 | 6.3 | 3.6 | 20.9 | 17.6 | 23.5 | 5.9 | 1.4 | 15.9 | 13.4 | 17.8 | 4.4 | 1.2 | ||
| 75.9 | 73.2 | 78.7 | 5.5 | 2.3 | 67.0 | 65.2 | 68.7 | 3.5 | 1.8 | 19.4 | 17.4 | 21.3 | 3.9 | 0.2 | 14.9 | 13.5 | 16.3 | 2.8 | 0.0 | ||
| 75.9 | 73.5 | 78.3 | 4.8 | 4.5 | 66.9 | 65.4 | 68.4 | 3.0 | 3.5 | 19.6 | 17.9 | 21.1 | 3.2 | 2.5 | 14.9 | 13.7 | 16.0 | 2.3 | 1.7 | ||
| 75.6 | 72.0 | 79.3 | 7.3 | 4.2 | 66.8 | 64.3 | 69.4 | 5.1 | 3.5 | 20.3 | 17.8 | 22.4 | 4.6 | 2.1 | 15.7 | 13.8 | 17.3 | 3.5 | 1.6 | ||
| 75.4 | 70.6 | 79.8 | 9.2 | 5.2 | 66.2 | 62.9 | 69.3 | 6.4 | 4.6 | 20.5 | 17.2 | 23.0 | 5.8 | 2.2 | 15.6 | 13.2 | 17.4 | 4.2 | 1.7 | ||
| 75.1 | 71.6 | 78.6 | 7.0 | 3.5 | 66.3 | 63.9 | 68.7 | 4.8 | 2.8 | 19.8 | 17.4 | 22.0 | 4.6 | 2.2 | 15.2 | 13.4 | 16.9 | 3.5 | 1.5 | ||
| 74.8 | 72.8 | 76.9 | 4.1 | 3.7 | 66.1 | 65.1 | 67.3 | 2.2 | 2.9 | 18.3 | 17.0 | 19.6 | 2.6 | 1.9 | 14.0 | 13.1 | 14.9 | 1.8 | 1.3 | ||
| 74.8 | 69.7 | 79.6 | 9.9 | 6.0 | 66.0 | 62.3 | 69.4 | 7.1 | 5.2 | 19.7 | 16.0 | 22.5 | 6.5 | 2.5 | 15.1 | 12.3 | 17.2 | 4.9 | 2.0 | ||
| 74.0 | 70.0 | 77.6 | 7.6 | 10.9 | 65.0 | 62.4 | 67.4 | 5.0 | 8.9 | 19.5 | 16.8 | 21.4 | 4.6 | 4.2 | 14.8 | 13.0 | 16.2 | 3.2 | 3.0 | ||
| 73.3 | 68.8 | 77.8 | 9.0 | 3.9 | 64.7 | 61.4 | 67.9 | 6.5 | 2.8 | 18.8 | 16.0 | 21.0 | 5.0 | 1.8 | 14.4 | 12.4 | 16.1 | 3.7 | 1.0 | ||
| 73.3 | 69.3 | 77.1 | 7.8 | 6.4 | 64.5 | 61.9 | 67.1 | 5.2 | 5.2 | 19.0 | 16.6 | 20.9 | 4.3 | 3.2 | 14.6 | 12.8 | 16.0 | 3.2 | 2.5 | ||
| World | 73.3 | 70.8 | 75.9 | 5.1 | 6.5 | 63.7 | 62.5 | 64.9 | 2.4 | 5.4 | 21.1 | 19.5 | 22.7 | 3.2 | 2.3 | 15.8 | 14.8 | 16.6 | 1.8 | 1.7 | |
| 73.2 | 68.2 | 78.0 | 9.8 | 7.9 | 64.2 | 60.7 | 67.5 | 6.8 | 6.9 | 19.9 | 16.8 | 22.2 | 5.4 | 3.5 | 15.0 | 12.8 | 16.7 | 3.9 | 2.7 | ||
| 73.0 | 68.0 | 77.8 | 9.8 | 5.5 | 64.3 | 60.6 | 67.8 | 7.2 | 4.6 | 19.5 | 16.4 | 21.7 | 5.3 | 2.7 | 15.0 | 12.7 | 16.7 | 4.0 | 2.2 | ||
| 71.4 | 68.8 | 74.1 | 5.3 | 5.9 | 63.6 | 62.1 | 65.2 | 3.1 | 5.1 | 17.1 | 15.6 | 18.3 | 2.7 | 0.5 | 13.4 | 12.4 | 14.2 | 1.8 | 0.3 | ||
Charts and maps
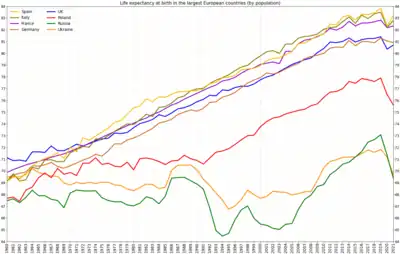 Life expectancy in the largest by population European countries[1]
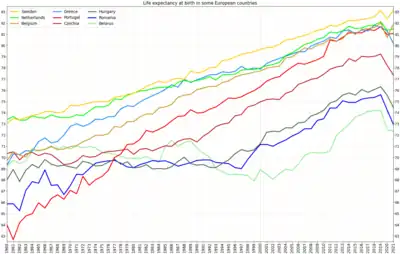 Life expectancy in some European countries
(continue)[1]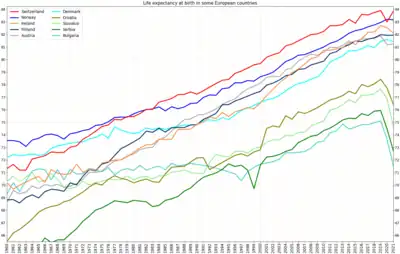 Life expectancy in some European countries
(continue)[1]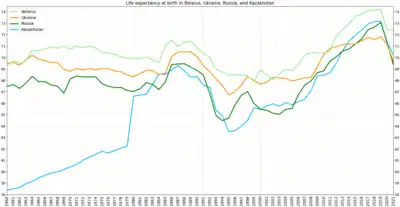 Life expectancy in the largest post-USSR countries located at the territory of Europe[1]
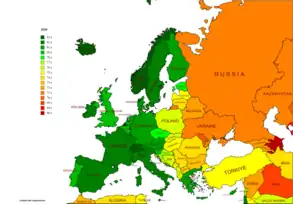
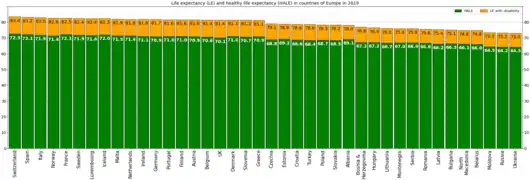 Life expectancy and HALE in countries of Europe in 2019[7]
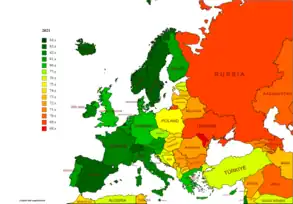
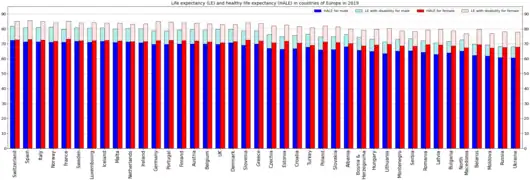 Elaboration by gender[7]
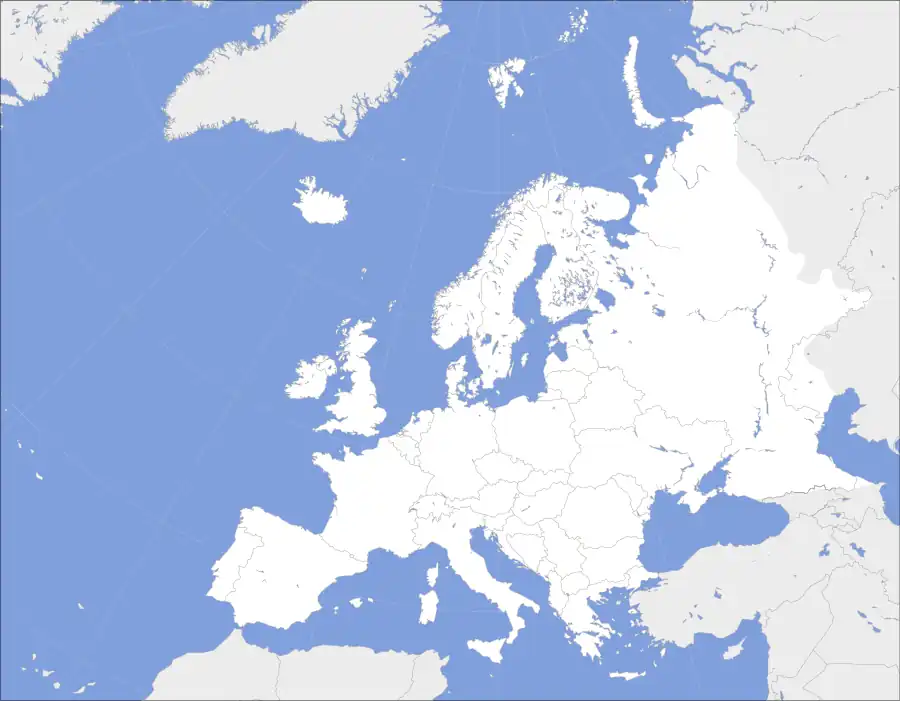
.svg.png.webp)
|
More than 82 years
Between 80 and 82 years
Between 78 and 80 years |
Between 75 and 78 years
Between 73 and 75 years
Less than 73 years
No data |
The map and table below cites life expectancy per country from The World Bank's 2019 statistics.[1]
See also
- List of countries by life expectancy
- List of European Union countries by life expectancy
- List of European regions by life expectancy
- List of European countries by population
- List of German states by life expectancy
- List of federal subjects of Russia by life expectancy
- Oldest people
- Longevity
- Life extension
Plotted maps
- European countries by electricity consumption per person
- European countries by employment in agriculture (% of employed)
- European countries by fossil fuel use (% of total energy)
- European countries by health expense per person
- European countries by military expenditure as a percentage of government expenditure
- European countries by percent of population aged 0-14
- European countries by percentage of urban population
- European countries by percentage of women in national parliaments
- List of European countries by number of Internet users
- International organisations in Europe
- List of European countries by budget revenues
- List of European countries by budget revenues per capita
- List of European countries by GDP (nominal) per capita
- List of European countries by GDP (PPP) per capita
- List of European countries by GNI (nominal) per capita
- List of European countries by GNI (PPP) per capita
- List of countries by GDP (nominal) per capita
- List of countries by GDP (PPP) per capita
- List of countries by GDP (nominal)
- List of countries by GDP (PPP)
References
- 1 2 3 4 5 6 7 "Life expectancy at birth, total". The World Bank Group. 29 June 2023. Retrieved 6 July 2023.
- ↑ "Life expectancy at birth, male". The World Bank Group. 29 June 2023. Retrieved 6 July 2023.
- ↑ "Life expectancy at birth, female". The World Bank Group. 29 June 2023. Retrieved 6 July 2023.
- ↑ "Human Development Report 2020 (tables 1 and 4)" (PDF). UN Development Programme. Archived from the original (PDF) on 15 December 2020. Retrieved 28 February 2021.
- ↑ "Human Development Report 2021/2022 (tables 1 and 4)" (PDF). UN Development Programme. Retrieved 28 June 2023.
- ↑ "Population & Demography Data Explorer". Retrieved 3 July 2023.
- 1 2 3 "Life expectancy and Healthy life expectancy, data by country". World Health Organization. 4 December 2022.
- ↑ "Life expectancy and Healthy life expectancy, data by WHO region". World Health Organization. 7 December 2022.
- ↑ "WHO: Europe: Countries". World Health Organization. Retrieved 7 May 2022.