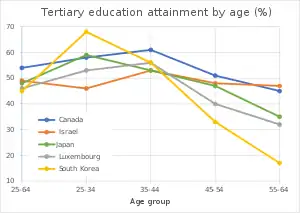
This is a list of countries by the proportions of 25- to 64-year-olds having completed tertiary education as published by the OECD. It includes some non-OECD nations.
Tertiary education is the educational level following the completion of a school providing a secondary education. The World Bank, for example, defines tertiary education as including universities as well as institutions that teach specific capacities of higher learning such as colleges, technical training institutes, community colleges, nursing schools, research laboratories, centers of excellence, and distance learning centers.[1]
2019 OECD data
This list includes non-OECD member countries: Brazil, China, Costa Rica, Indonesia, Russia, Saudi Arabia, and South Africa.[2]
Country |
Age 25–64 (%) |
Age | Year |
Non-OECD | |||
|---|---|---|---|---|---|---|---|
| 25–34 (%) | 35–44 (%) | 45–54 (%) | 55–64 (%) | ||||
| 42 | 48 | 46 | 38 | 33 | 2014 | ||
| 30 | 38 | 33 | 27 | 21 | 2014 | ||
| 37 | 44 | 42 | 34 | 26 | 2014 | ||
| 14 | 15 | 14 | 14 | 11 | 2013 | ||
| 54 | 58 | 61 | 51 | 45 | 2014 | ||
| 36 | 38 | 34 | 28 | 26 | 2014 | ||
| 17 | 27 | 15 | 7 | 2 | 2018 | ||
| 22 | 28 | 23 | 18 | 16 | 2014 | ||
| 18 | 21 | 19 | 17 | 17 | 2014 | ||
| 22 | 30 | 21 | 20 | 15 | 2014 | ||
| 36 | 42 | 41 | 33 | 29 | 2014 | ||
| 38 | 40 | 39 | 35 | 36 | 2014 | ||
| 42 | 40 | 50 | 44 | 34 | 2014 | ||
| 32 | 44 | 39 | 26 | 20 | 2013 | ||
| 27 | 28 | 29 | 26 | 25 | 2014 | ||
| 28 | 39 | 27 | 26 | 21 | 2014 | ||
| 23 | 32 | 25 | 20 | 17 | 2014 | ||
| 37 | 41 | 42 | 36 | 29 | 2014 | ||
| 12 | 16 | 9 | 8 | 4 | 2018 | ||
| 41 | 51 | 49 | 34 | 24 | 2014 | ||
| 49 | 46 | 53 | 48 | 47 | 2014 | ||
| 17 | 24 | 19 | 13 | 12 | 2014 | ||
| 48 | 59 | 53 | 47 | 35 | 2014 | ||
| 30 | 39 | 31 | 27 | 23 | 2014 | ||
| 37 | 53 | 38 | 30 | 28 | 2014 | ||
| 46 | 53 | 56 | 40 | 32 | 2014 | ||
| 19 | 25 | 17 | 16 | 13 | 2014 | ||
| 34 | 44 | 38 | 30 | 27 | 2014 | ||
| 36 | 40 | 41 | 32 | 29 | 2014 | ||
| 42 | 49 | 49 | 36 | 32 | 2014 | ||
| 27 | 43 | 32 | 18 | 14 | 2014 | ||
| 22 | 31 | 26 | 17 | 13 | 2014 | ||
| 54 | 58 | 55 | 53 | 50 | 2013 | ||
| 22 | 26 | 22 | 18 | 14 | 2013 | ||
| 20 | 30 | 21 | 15 | 14 | 2014 | ||
| 29 | 38 | 35 | 24 | 18 | 2014 | ||
| 7 | 5 | 7 | 8 | 7 | 2012 | ||
| 45 | 68 | 56 | 33 | 17 | 2014 | ||
| 35 | 41 | 43 | 30 | 21 | 2014 | ||
| 39 | 46 | 46 | 32 | 30 | 2014 | ||
| 40 | 46 | 45 | 38 | 31 | 2014 | ||
| 17 | 25 | 16 | 10 | 10 | 2014 | ||
| 45 | X | X | X | X | 2015 | ||
| 42 | 49 | 46 | 38 | 35 | 2014 | ||
| 44 | 46 | 47 | 43 | 41 | 2014 | ||
Countries by level of tertiary education
This is a list of countries by the level of tertiary education completed by 25–34 year olds measured by the percent of the population who have attained various standards. Columns from left to right indicate the percentages of 25–34 year olds that have completed:
- at least a 2-year tertiary degree or its equivalent (an associate degree in most anglophone countries)
- a 4-year degree or higher (a bachelor's degree in most anglophone countries)
- a 6-year degree or higher (a master's degree in most anglophone countries).[5]
| Country | Ages 25–34: % equivalent to a degree course lasting at least: | Year | Non-OECD? | ||
|---|---|---|---|---|---|
| 2 years | 4 years | 6 years | |||
| 48 | 39 | 9 | 2015 | ||
| 39 | 24 | 15 | 2015 | ||
| 43 | 43 | 20 | 2015 | ||
| 16 | 16 | NA | 2014 | ||
| 59 | 34 | 9 | 2015 | ||
| 36 | 27 | 9 | 2014 | ||
| 35.8 | 17.8 | 2.3 | 2020[6] | ||
| 27 | 27 | NA | 2015 | ||
| 28 | 18 | 1 | 2015 | ||
| 31 | 31 | 20 | 2015 | ||
| 44 | 40 | 17 | 2015 | ||
| 41 | 39 | 16 | 2015 | ||
| 41 | 41 | 14 | 2015 | ||
| 45 | 28 | 16 | 2014 | ||
| 30 | 28 | 13 | 2015 | ||
| 40 | 39 | 3 | 2015 | ||
| 32 | 29 | 13 | 2015 | ||
| 40 | 37 | 11 | 2015 | ||
| 11 | 11 | NA | 2013 | ||
| 52 | 40 | 11 | 2015 | ||
| 46 | 35 | 17 | 2015 | ||
| 25 | 25 | 15 | 2015 | ||
| 60 | 40 | NA | 2015 | ||
| 40 | 35 | 12 | 2015 | ||
| 55 | 55 | 17 | 2015 | ||
| 50 | 44 | 27 | 2015 | ||
| 21 | 20 | 1 | 2015 | ||
| 45 | 44 | 17 | 2015 | ||
| 39 | 36 | 4 | 2015 | ||
| 48 | 34 | 13 | 2015 | ||
| 43 | 43 | 31 | 2015 | ||
| 33 | 33 | 21 | 2015 | ||
| 58 | 58 | NA | 2013 | ||
| 26 | 26 | NA | 2014 | ||
| 31 | 31 | 25 | 2015 | ||
| 41 | 34 | 24 | 2015 | ||
| 14 | 14 | NA | 2014 | ||
| 69 | 47 | NA | 2015 | ||
| 41 | 28 | 17 | 2015 | ||
| 46 | 35 | 14 | 2015 | ||
| 49 | 49 | 23 | 2015 | ||
| 28 | 19 | 2 | 2015 | ||
| 49 | 42 | 14 | 2015 | ||
| 51.1 | 40.8 | 12 | 2021[7] | ||
See also
Notes
- ↑ "Tertiary Education (Higher Education)". The World Bank.
- ↑ "OECD.Stat Education and Training > Education at a Glance > Educational attainment and labor-force status > Educational attainment of 25-64 year-olds". OECD.
- ↑ "Education at a Glance Indonesia" (PDF). OECD.
- ↑ "Higher Education Crisis in Taiwan | The World View".
- ↑ http://www.keepeek.com/Digital-Asset-Management/oecd/education/education-at-a-glance-2016_eag-2016-en#page44 OECD Education at a glance 2016
- ↑ National Bureau of Statistics of China. "Table 2-25 Population Aged 6 and over by Age, Gender and Education Attainment". China Statistical Yearbook 2021.
- ↑ "Census Bureau Releases New Educational Attainment Data".
References
- Brick, Jean (2006). "What is academic culture?". Academic Culture: A Student's Guide to Studying at University. Sydney, N.S.W: National Centre for English Language Teaching and Research. pp. 1–10. ISBN 978-1-74138-135-1.