This is a list of world regions by life expectancy at birth.
List by the World Bank Group (2021)
Estimation of the World Bank Group for 2021.[1][2][3] The values in the World Bank Group tables are rounded. All calculations are based on raw data, so due to the nuances of rounding, in some places illusory inconsistencies of indicators arose, with a size of 0.01 year.
| World regions | 2021 | Historical data | COVID-19 impact | ||||||||||||
|---|---|---|---|---|---|---|---|---|---|---|---|---|---|---|---|
| All | Male | Female | Gender gap |
2000 | 2000 →2014 |
2014 | 2014 →2019 |
2019 | 2019 →2020 |
2020 | 2020 →2021 |
2021 | 2019 →2021 |
2014 →2021 | |
| European Union | 80.39 | 77.66 | 83.27 | 5.61 | 77.08 | 3.80 | 80.87 | 0.44 | 81.31 | −0.86 | 80.45 | −0.06 | 80.39 | −0.93 | −0.48 |
| North America | 76.98 | 74.24 | 79.85 | 5.62 | 76.89 | 2.25 | 79.14 | 0.01 | 79.14 | −1.68 | 77.46 | −0.49 | 76.98 | −2.16 | −2.16 |
| Europe & Central Asia | 76.63 | 73.51 | 79.95 | 6.44 | 73.13 | 4.16 | 77.30 | 0.89 | 78.19 | −1.23 | 76.96 | −0.33 | 76.63 | −1.56 | −0.67 |
| East Asia & Pacific | 76.39 | 73.64 | 79.33 | 5.69 | 71.55 | 4.18 | 75.73 | 1.07 | 76.80 | −0.04 | 76.76 | −0.37 | 76.39 | −0.40 | 0.66 |
| Central Europe & the Baltics | 74.93 | 71.32 | 78.73 | 7.41 | 72.72 | 3.96 | 76.68 | 0.59 | 77.27 | −1.18 | 76.09 | −1.16 | 74.93 | −2.33 | −1.74 |
| Middle East & North Africa | 72.75 | 70.64 | 75.08 | 4.44 | 69.28 | 3.34 | 72.62 | 1.34 | 73.96 | −1.01 | 72.95 | −0.20 | 72.75 | −1.21 | 0.12 |
| Latin America & Caribbean | 72.15 | 68.80 | 75.70 | 6.90 | 71.23 | 3.32 | 74.55 | 0.49 | 75.04 | −2.00 | 73.04 | −0.89 | 72.15 | −2.89 | −2.40 |
| World | 71.33 | 68.89 | 73.95 | 5.06 | 67.70 | 4.18 | 71.88 | 1.10 | 72.98 | −0.74 | 72.24 | −0.92 | 71.33 | −1.65 | −0.55 |
| Arab world | 70.81 | 68.83 | 72.99 | 4.16 | 67.30 | 3.20 | 70.49 | 1.35 | 71.84 | −0.92 | 70.92 | −0.11 | 70.81 | −1.03 | 0.32 |
| South Asia | 67.58 | 65.89 | 69.43 | 3.54 | 62.89 | 5.75 | 68.64 | 1.83 | 70.47 | −0.72 | 69.75 | −2.17 | 67.58 | −2.89 | −1.06 |
| Africa Eastern & Southern | 62.45 | 59.89 | 65.08 | 5.18 | 51.96 | 9.37 | 61.34 | 2.42 | 63.76 | −0.44 | 63.31 | −0.86 | 62.45 | −1.30 | 1.12 |
| Sub-Saharan Africa | 60.24 | 58.26 | 62.28 | 4.01 | 51.26 | 7.88 | 59.14 | 2.10 | 61.24 | −0.40 | 60.85 | −0.61 | 60.24 | −1.00 | 1.10 |
| Africa Western & Central | 56.99 | 55.90 | 58.10 | 2.20 | 50.22 | 5.70 | 55.92 | 1.63 | 57.56 | −0.33 | 57.23 | −0.24 | 56.99 | −0.57 | 1.07 |
List by the United Nations (2021)
Estimation of the analytical agency of the UN for 2019 and 2021.[4][5][6] By default, the list is sorted by 2021.
| World regions | 2019 | 2021 | 2019 →2021 | ||||||
|---|---|---|---|---|---|---|---|---|---|
| All | Male | Female | Gender gap |
All | Male | Female | Gender gap | ||
| East Asia & Pacific | 75.4 | 73.1 | 78.0 | 4.9 | 75.6 | 72.9 | 78.5 | 5.6 | 0.2 |
| Europe & Central Asia | 74.4 | 71.1 | 77.7 | 6.6 | 72.9 | 69.4 | 76.4 | 7.0 | −1.5 |
| Latin America & Caribbean | 75.6 | 72.4 | 78.7 | 6.3 | 72.1 | 68.8 | 75.6 | 6.8 | −3.5 |
| World | 72.8 | 70.6 | 75.0 | 4.4 | 71.4 | 68.9 | 74.0 | 5.1 | −1.4 |
| Arab states | 72.1 | 70.4 | 73.9 | 3.5 | 70.9 | 68.9 | 73.1 | 4.2 | −1.2 |
| South Asia | 69.9 | 68.7 | 71.3 | 2.6 | 67.9 | 66.1 | 69.8 | 3.7 | −2.0 |
| Sub-Saharan Africa | 61.5 | 59.8 | 63.3 | 3.5 | 60.1 | 58.2 | 62.1 | 3.9 | −1.4 |
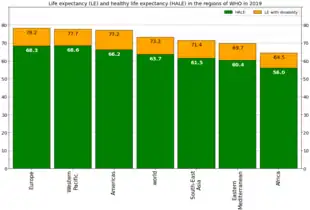
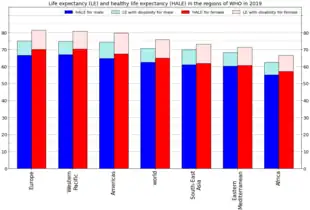
List by World Health Organization (2019)
Estimation of the World Health Organization for 2019.[7]
| WHO regions[8] | Life expectancy at birth | HALE at birth | Life expectancy at age 60 | HALE at age 60 | ||||||||||||||||
|---|---|---|---|---|---|---|---|---|---|---|---|---|---|---|---|---|---|---|---|---|
| All | M | F | FΔM | Δ 2000 |
All | M | F | FΔM | Δ 2000 |
All | M | F | FΔM | Δ 2000 |
All | M | F | FΔM | Δ 2000 | |
| Europe[9] | 78.2 | 75.1 | 81.3 | 6.2 | 5.7 | 68.3 | 66.6 | 70.0 | 3.4 | 4.6 | 22.5 | 20.5 | 24.3 | 3.8 | 2.9 | 17.1 | 15.8 | 18.3 | 2.5 | 2.1 |
| Western Pacific[10] | 77.7 | 74.8 | 80.8 | 6.0 | 5.3 | 68.6 | 67.0 | 70.2 | 3.2 | 4.3 | 21.8 | 19.8 | 23.9 | 4.1 | 2.5 | 16.5 | 15.4 | 17.7 | 2.3 | 1.8 |
| Americas[11] | 77.2 | 74.5 | 79.8 | 5.3 | 3.1 | 66.2 | 64.8 | 67.5 | 2.7 | 2.1 | 22.7 | 21.2 | 24.0 | 2.8 | 1.6 | 16.6 | 15.7 | 17.4 | 1.7 | 0.9 |
| World | 73.3 | 70.8 | 75.9 | 5.1 | 6.5 | 63.7 | 62.5 | 64.9 | 2.4 | 5.4 | 21.1 | 19.5 | 22.7 | 3.2 | 2.3 | 15.8 | 14.8 | 16.6 | 1.8 | 1.7 |
| South-East Asia[12] | 71.4 | 69.9 | 73.1 | 3.2 | 8.0 | 61.5 | 61.1 | 61.9 | 0.8 | 7.0 | 19.1 | 18.2 | 20.0 | 1.8 | 2.5 | 13.7 | 13.3 | 14.1 | 0.8 | 1.7 |
| Eastern Mediterranean[13] | 69.7 | 68.3 | 71.3 | 3.0 | 4.7 | 60.4 | 60.2 | 60.7 | 0.5 | 3.8 | 18.5 | 17.8 | 19.3 | 1.5 | 1.1 | 13.6 | 13.4 | 13.9 | 0.5 | 0.7 |
| Africa[14] | 64.5 | 62.4 | 66.6 | 4.2 | 11.8 | 56.0 | 55.0 | 57.1 | 2.1 | 10.2 | 17.9 | 16.7 | 19.0 | 2.3 | 2.4 | 13.3 | 12.6 | 13.9 | 1.3 | 1.8 |
Charts


See also
References
- 1 2 3 "Life expectancy at birth, total". The World Bank Group. 29 June 2023. Retrieved 6 July 2023.
- ↑ "Life expectancy at birth, male". The World Bank Group. 29 June 2023. Retrieved 6 July 2023.
- ↑ "Life expectancy at birth, female". The World Bank Group. 29 June 2023. Retrieved 6 July 2023.
- ↑ "Human Development Report 2020 (tables 1 and 4)" (PDF). United Nations Development Programme. Archived from the original (PDF) on 2020-12-15. Retrieved 2021-02-28.
- ↑ "Human Development Report 2021/2022 (tables 1 and 4)" (PDF). United Nations Development Programme. Retrieved 2023-06-28.
- ↑ "Population & Demography Data Explorer". Retrieved 2023-07-03.
- 1 2 3 "Life expectancy and Healthy life expectancy, data by WHO region". World Health Organization. 7 December 2020.
- ↑ "WHO: Countries". World Health Organization. Retrieved 7 May 2022.
- ↑ "WHO: Europe: Countries". World Health Organization. Retrieved 7 May 2022.
- ↑ "WHO: Western Pacific: Where we work". World Health Organization. Retrieved 7 May 2022.
- ↑ "WHO: PAHO: Countries and Centers". World Health Organization. Retrieved 7 May 2022.
- ↑ "WHO: South-East Asia: Where we work". World Health Organization. Retrieved 7 May 2022.
- ↑ "WHO: Eastern Mediterranean: Countries". World Health Organization. Retrieved 7 May 2022.
- ↑ "WHO: Africa: Countries". World Health Organization. Retrieved 7 May 2022.
This article is issued from Wikipedia. The text is licensed under Creative Commons - Attribution - Sharealike. Additional terms may apply for the media files.