| |||||||||||||||||||||||||||||||||||||||||||||||||||||||||||||||||||||||
125 seats in the 31st Legislative Assembly of Ontario 63 seats needed for a majority | |||||||||||||||||||||||||||||||||||||||||||||||||||||||||||||||||||||||
|---|---|---|---|---|---|---|---|---|---|---|---|---|---|---|---|---|---|---|---|---|---|---|---|---|---|---|---|---|---|---|---|---|---|---|---|---|---|---|---|---|---|---|---|---|---|---|---|---|---|---|---|---|---|---|---|---|---|---|---|---|---|---|---|---|---|---|---|---|---|---|---|
| |||||||||||||||||||||||||||||||||||||||||||||||||||||||||||||||||||||||
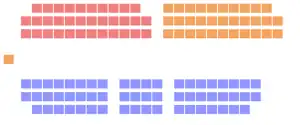 Seating in chamber after the election | |||||||||||||||||||||||||||||||||||||||||||||||||||||||||||||||||||||||
| |||||||||||||||||||||||||||||||||||||||||||||||||||||||||||||||||||||||


The 1977 Ontario general election was held on June 9, 1977, to elect the 125 members of the 31st Legislative Assembly of Ontario.
The Progressive Conservative Party, led by Premier Bill Davis, was re-elected for an eleventh consecutive term in office, again with a minority in the legislature. The PCs won an additional seven seats, but were not able to win a majority. The Liberal Party, led by Dr. Stuart Smith, lost one seat compared to its result in the previous election, but formed the Official Opposition because the NDP lost more seats. The New Democratic Party, led by Stephen Lewis, lost five seats, losing the status of Official Opposition to the Liberals.
Sheila Copps, future federal cabinet minister and Deputy Prime Minister of Canada, made her political debut in this election, finishing second in the riding of Hamilton Centre. This was the first election in which Jim Bradley, the second-longest serving MPP in Ontario history, was elected.
Renaming of ridings
A 1976 Act[1] made changes to the names of two ridings:
| Renaming of ridings | |
|---|---|
| Old | New |
Campaign
| Candidates | PC | Lib | LL | NDP | Comm | Ltn | Ind | SC | D | Total |
|---|---|---|---|---|---|---|---|---|---|---|
| 3 | 64 | 62 | 2 | 64 | 192 | |||||
| 4 | 37 | 37 | 37 | 16 | 10 | 7 | 4 | 148 | ||
| 5 | 14 | 14 | 14 | 8 | 13 | 6 | 1 | 70 | ||
| 6 | 8 | 8 | 8 | 7 | 7 | 8 | 2 | 48 | ||
| 7 | 2 | 2 | 2 | 2 | 1 | 4 | 1 | 14 | ||
| Total | 125 | 123 | 2 | 125 | 33 | 31 | 25 | 7 | 1 | 472 |
A number of unregistered parties also contested this election. The North American Labour Party, consisting of Lyndon LaRouche supporters, ran three candidates in Toronto and three elsewhere in the province. The Revolutionary Marxist Group and League for Socialist Action fielded one candidate apiece; soon after the election, both groups merged into the Revolutionary Workers League.
Some members of the Social Credit Party also ran in the election, although it is not clear if they were formally endorsed by the party.
Results
| Political party | Party leader | MPPs | Votes | |||||||
|---|---|---|---|---|---|---|---|---|---|---|
| Candidates | 1975 | 1977 | ± | # | ± | % | ± (pp) | |||
| Progressive Conservative | Bill Davis | 125 | 51 | 58 | 7 | 1,322,723 | 129,771 | 39.58% | 3.51 | |
| Liberal | Stuart Smith | 123 | 35 | 33 | 2 | 1,042,464 | 83,151 | 31.19% | 2.85 | |
| Liberal–Labour | 2 | 1 | 1 | 8,242 | 824 | 0.25% | 0.02 | |||
| New Democratic | Stephen Lewis | 125 | 38 | 33 | 5 | 940,961 | 15,943 | 28.16% | 0.78 | |
| Libertarian | Paul Mollon | 31 | – | – | – | 9,961 | 5,524 | 0.30% | 0.17 | |
| Communist | William Stewart | 33 | – | – | – | 8,137 | 983 | 0.24% | 0.04 | |
| Independent | 25 | – | – | – | 7,414 | 3,321 | 0.22% | 0.10 | ||
| Social Credit | 7 | – | – | – | 1,698 | 2,448 | 0.05% | 0.08 | ||
| Democrat | 1 | – | – | – | 233 | 233 | 0.01% | New | ||
| Total | 472 | 125 | 125 | 3,341,833 | 100.00% | |||||
| Rejected ballots | 19,600 | 1,663 |
||||||||
| Voter turnout | 3,361,433 | 50,657 |
65.60 | 2.22 | ||||||
| Registered electors | 5,123,768 | 620,626 |
||||||||
| Party | Seats | Votes | Change (pp) | ||
|---|---|---|---|---|---|
| █ Progressive Conservative | 58 / 125 | 39.58% | 3.51 | ||
| █ Liberal/Liberal-Labour | 34 / 125 | 31.44% | -2.87 | ||
| █ New Democratic | 33 / 125 | 28.16% | -0.78 | ||
| █ Independent | 0 / 125 | 0.22% | 0.10 | ||
| █ Other | 0 / 125 | 0.60% | 0.04 | ||
Synopsis of results
| Riding | Winning party | Turnout [a 1] |
Votes | ||||||||||||
|---|---|---|---|---|---|---|---|---|---|---|---|---|---|---|---|
| Name[a 2] | 1975 | Party | Votes | Share | Margin # |
Margin % |
PC | Lib/LL | NDP | Ind | Other | Total | |||
| Algoma | NDP | NDP | 6,917 | 48.70% | 1,166 | 8.21% | 77.64% | 5,751 | 1,534 | 6,917 | – | – | 14,202 | ||
| Algoma—Manitoulin | PC | PC | 7,381 | 56.64% | 3,895 | 29.89% | 64.79% | 7,381 | 2,165 | 3,486 | – | – | 13,032 | ||
| Brampton | PC | PC | 19,641 | 51.92% | 9,744 | 25.76% | 64.25% | 19,641 | 7,948 | 9,897 | 130 | 216 | 37,832 | ||
| Brantford | NDP | NDP | 13,376 | 46.79% | 4,295 | 15.02% | 64.87% | 9,081 | 6,130 | 13,376 | – | – | 28,587 | ||
| Brant—Oxford—Norfolk | Lib | Lib | 14,256 | 57.42% | 8,444 | 34.01% | 65.07% | 5,812 | 14,256 | 4,760 | – | – | 24,828 | ||
| Brock | PC | PC | 11,944 | 51.78% | 6,034 | 26.16% | 65.73% | 11,944 | 5,910 | 5,215 | – | – | 23,069 | ||
| Burlington South | PC | PC | 18,892 | 51.06% | 8,418 | 22.75% | 65.74% | 18,892 | 10,474 | 7,015 | – | 615 | 36,996 | ||
| Cambridge | NDP | NDP | 11,120 | 37.31% | 554 | 1.86% | 65.02% | 10,566 | 7,870 | 11,120 | – | 252 | 29,808 | ||
| Carleton | PC | PC | 14,847 | 46.51% | 4,606 | 14.43% | 62.96% | 14,847 | 10,241 | 6,837 | – | – | 31,925 | ||
| Carleton East | NDP | NDP | 12,733 | 34.77% | 681 | 1.86% | 65.09% | 12,052 | 11,837 | 12,733 | – | – | 36,622 | ||
| Carleton-Grenville | PC | PC | 14,002 | 59.61% | 8,509 | 36.22% | 63.39% | 14,002 | 5,493 | 3,995 | – | – | 23,490 | ||
| Chatham—Kent | PC | PC | 10,769 | 46.48% | 4,287 | 18.50% | 59.34% | 10,769 | 5,919 | 6,482 | – | – | 23,170 | ||
| Cochrane North | PC | PC | 10,412 | 61.44% | 6,365 | 37.56% | 67.02% | 10,412 | 2,488 | 4,047 | – | – | 16,947 | ||
| Cochrane South | NDP | PC | 12,533 | 51.26% | 2,277 | 9.31% | 69.89% | 12,533 | 1,442 | 10,256 | – | 219 | 24,450 | ||
| Cornwall | NDP | NDP | 9,978 | 46.08% | 486 | 2.24% | 63.95% | 9,492 | 2,089 | 9,978 | 94 | – | 21,653 | ||
| Dufferin—Simcoe | PC | PC | 15,528 | 48.81% | 6,048 | 19.01% | 65.30% | 15,528 | 9,480 | 6,369 | – | 438 | 31,815 | ||
| Durham East | NDP | PC | 12,862 | 41.66% | 122 | 0.40% | 65.38% | 12,862 | 5,121 | 12,740 | 153 | – | 30,876 | ||
| Durham West | NDP | PC | 12,688 | 41.30% | 593 | 1.93% | 65.89% | 12,688 | 5,075 | 12,095 | 865 | – | 30,723 | ||
| Durham—York | PC | PC | 14,134 | 51.44% | 7,134 | 25.96% | 66.17% | 14,134 | 6,345 | 7,000 | – | – | 27,479 | ||
| Elgin | PC | PC | 12,655 | 47.48% | 3,481 | 13.06% | 68.91% | 12,655 | 9,174 | 4,654 | – | 172 | 26,655 | ||
| Erie | Lib | Lib | 10,008 | 48.71% | 4,175 | 20.32% | 65.53% | 5,833 | 10,008 | 4,704 | – | – | 20,545 | ||
| Essex North | Lib | Lib | 9,801 | 51.19% | 4,837 | 25.26% | 56.75% | 4,383 | 9,801 | 4,964 | – | – | 19,148 | ||
| Essex South | Lib | Lib | 11,215 | 45.69% | 3,224 | 13.13% | 68.48% | 7,991 | 11,215 | 5,340 | – | – | 24,546 | ||
| Fort William | NDP | PC | 12,230 | 46.28% | 2,256 | 8.54% | 66.03% | 12,230 | 4,080 | 9,974 | – | 142 | 26,426 | ||
| Frontenac—Addington | Lib | Lib | 10,505 | 44.63% | 940 | 3.99% | 67.46% | 9,565 | 10,505 | 3,157 | 312 | – | 23,539 | ||
| Grey | Lib | Lib | 14,651 | 55.39% | 7,062 | 26.70% | 72.77% | 7,589 | 14,651 | 4,210 | – | – | 26,450 | ||
| Grey—Bruce | Lib | Lib | 14,828 | 55.47% | 5,403 | 20.21% | 75.53% | 9,425 | 14,828 | 2,477 | – | – | 26,730 | ||
| Haldimand—Norfolk | Lib | Lib | 15,496 | 49.37% | 3,864 | 12.31% | 71.38% | 11,632 | 15,496 | 4,257 | – | – | 31,385 | ||
| Halton—Burlington | Lib | Lib | 13,985 | 46.82% | 3,698 | 12.38% | 69.13% | 10,287 | 13,985 | 5,598 | – | – | 29,870 | ||
| Hamilton Centre | NDP | NDP | 8,216 | 37.86% | 14 | 0.06% | 58.29% | 5,092 | 8,202 | 8,216 | – | 189 | 21,699 | ||
| Hamilton East | NDP | NDP | 14,461 | 47.09% | 5,195 | 16.92% | 63.63% | 6,605 | 9,266 | 14,461 | – | 376 | 30,708 | ||
| Hamilton Mountain | PC | NDP | 12,681 | 38.26% | 373 | 1.13% | 72.12% | 12,308 | 7,910 | 12,681 | – | 247 | 33,146 | ||
| Hamilton West | Lib | Lib | 12,239 | 43.05% | 3,860 | 13.58% | 69.78% | 8,379 | 12,239 | 7,668 | 144 | – | 28,430 | ||
| Hastings—Peterborough | PC | PC | 11,442 | 47.22% | 1,858 | 7.67% | 73.02% | 11,442 | 9,584 | 2,808 | 247 | 149 | 24,230 | ||
| Huron—Bruce | Lib | Lib | 17,356 | 65.17% | 9,833 | 36.92% | 74.18% | 7,523 | 17,356 | 1,754 | – | – | 26,633 | ||
| Huron—Middlesex | Lib | Lib | 12,749 | 55.35% | 3,871 | 16.81% | 76.72% | 8,878 | 12,749 | 1,405 | – | – | 23,032 | ||
| Kenora | PC | PC | 10,882 | 57.14% | 5,626 | 29.54% | 67.29% | 10,882 | 2,907 | 5,256 | – | – | 19,045 | ||
| Kent—Elgin | Lib | Lib | 10,038 | 45.72% | 641 | 2.92% | 66.86% | 9,397 | 10,038 | 2,521 | – | – | 21,956 | ||
| Kingston and the Islands | PC | PC | 12,246 | 52.32% | 5,756 | 24.59% | 61.57% | 12,246 | 6,490 | 4,510 | – | 158 | 23,404 | ||
| Kitchener | Lib | Lib | 14,425 | 52.06% | 7,515 | 27.12% | 59.47% | 6,910 | 14,425 | 6,264 | – | 111 | 27,710 | ||
| Kitchener—Wilmot | Lib | Lib | 12,450 | 51.07% | 5,980 | 24.53% | 58.08% | 6,470 | 12,450 | 5,456 | – | – | 24,376 | ||
| Lake Nipigon | NDP | NDP | 7,747 | 67.01% | 5,330 | 46.10% | 58.91% | 2,417 | 1,397 | 7,747 | – | – | 11,561 | ||
| Lambton | PC | PC | 11,604 | 52.63% | 2,863 | 12.99% | 70.48% | 11,604 | 8,741 | 1,702 | – | – | 22,047 | ||
| Lanark | PC | PC | 11,086 | 55.42% | 6,089 | 30.44% | 67.67% | 11,086 | 3,919 | 4,997 | – | – | 20,002 | ||
| Leeds | PC | PC | 14,853 | 67.65% | 11,151 | 50.79% | 62.33% | 14,853 | 3,702 | 3,400 | – | – | 21,955 | ||
| Lincoln | Lib | Lib | 9,969 | 44.98% | 582 | 2.63% | 70.96% | 9,387 | 9,969 | 2,806 | – | – | 22,162 | ||
| London Centre | Lib | Lib | 12,808 | 45.42% | 3,893 | 13.80% | 59.52% | 6,279 | 12,808 | 8,915 | 200 | – | 28,202 | ||
| London North | Lib | Lib | 15,033 | 46.99% | 4,402 | 13.76% | 66.11% | 10,631 | 15,033 | 6,130 | – | 201 | 31,995 | ||
| London South | Lib | PC | 16,011 | 42.39% | 2,211 | 5.85% | 63.70% | 16,011 | 13,800 | 7,964 | – | – | 37,775 | ||
| Middlesex | PC | PC | 10,427 | 42.88% | 1,538 | 6.33% | 75.29% | 10,427 | 8,889 | 4,998 | – | – | 24,314 | ||
| Mississauga East | PC | PC | 11,945 | 45.25% | 3,489 | 13.22% | 60.17% | 11,945 | 8,456 | 5,994 | – | – | 26,395 | ||
| Mississauga North | PC | PC | 16,151 | 46.56% | 3,750 | 10.81% | 63.04% | 16,151 | 5,684 | 12,401 | – | 451 | 34,687 | ||
| Mississauga South | PC | PC | 13,622 | 47.91% | 6,006 | 21.12% | 67.08% | 13,622 | 7,616 | 7,196 | – | – | 28,434 | ||
| Muskoka | PC | PC | 8,865 | 49.23% | 2,497 | 13.87% | 73.00% | 8,865 | 2,774 | 6,368 | – | – | 18,007 | ||
| Niagara Falls | Lib | Lib | 13,280 | 43.42% | 3,928 | 12.84% | 68.11% | 9,352 | 13,280 | 7,952 | – | – | 30,584 | ||
| Nickel Belt | NDP | NDP | 9,410 | 57.45% | 5,487 | 33.50% | 67.45% | 3,923 | 3,046 | 9,410 | – | – | 16,379 | ||
| Nipissing | Lib | Lib | 12,898 | 43.13% | 1,666 | 5.57% | 71.28% | 11,232 | 12,898 | 5,777 | – | – | 29,907 | ||
| Northumberland | PC | PC | 14,061 | 48.30% | 3,727 | 12.80% | 68.07% | 14,061 | 10,334 | 4,716 | – | – | 29,111 | ||
| Oakville | PC | PC | 14,456 | 50.97% | 6,508 | 22.95% | 70.88% | 14,456 | 7,948 | 5,955 | – | – | 28,359 | ||
| Oshawa | NDP | NDP | 12,226 | 53.23% | 5,714 | 24.88% | 56.08% | 6,512 | 4,032 | 12,226 | – | 199 | 22,969 | ||
| Ottawa Centre | NDP | NDP | 10,626 | 41.56% | 2,403 | 9.40% | 56.75% | 8,223 | 6,358 | 10,626 | – | 360 | 25,567 | ||
| Ottawa East | Lib | Lib | 15,864 | 67.44% | 11,809 | 50.20% | 52.10% | 4,055 | 15,864 | 3,605 | – | – | 23,524 | ||
| Ottawa South | PC | PC | 16,662 | 49.37% | 7,903 | 23.42% | 66.95% | 16,662 | 7,754 | 8,759 | 574 | – | 33,749 | ||
| Ottawa West | PC | PC | 15,729 | 45.79% | 5,823 | 16.95% | 66.08% | 15,729 | 9,906 | 8,718 | – | – | 34,353 | ||
| Oxford | PC | PC | 17,758 | 50.98% | 5,101 | 14.64% | 69.24% | 17,758 | 12,657 | 4,420 | – | – | 34,835 | ||
| Parry Sound | PC | PC | 9,929 | 49.66% | 2,419 | 12.10% | 70.52% | 9,929 | 7,510 | 2,553 | – | – | 19,992 | ||
| Perth | Lib | Lib | 18,201 | 68.88% | 12,145 | 45.96% | 60.70% | 6,056 | 18,201 | 2,167 | – | – | 26,424 | ||
| Peterborough | NDP | PC | 16,923 | 40.66% | 2,648 | 6.36% | 70.97% | 16,923 | 10,083 | 14,275 | – | 341 | 41,622 | ||
| Port Arthur | NDP | NDP | 9,629 | 40.14% | 339 | 1.41% | 61.46% | 9,290 | 4,818 | 9,629 | – | 254 | 23,991 | ||
| Prescott and Russell | PC | PC | 11,863 | 48.74% | 2,986 | 12.27% | 62.54% | 11,863 | 8,877 | 3,597 | – | – | 24,337 | ||
| Prince Edward—Lennox | PC | PC | 11,411 | 55.22% | 5,652 | 27.35% | 68.00% | 11,411 | 5,759 | 3,494 | – | – | 20,664 | ||
| Quinte | Lib | Lib | 17,264 | 56.34% | 7,255 | 23.68% | 68.31% | 10,009 | 17,264 | 3,371 | – | – | 30,644 | ||
| Rainy River | LL | LL | 5,335 | 45.90% | 2,067 | 17.79% | 63.80% | 3,268 | 5,335[a 3] | 3,019 | – | – | 11,622 | ||
| Renfrew North | Lib | Lib | 9,549 | 45.80% | 2,732 | 13.10% | 73.96% | 6,817 | 9,549 | 4,483 | – | – | 20,849 | ||
| Renfrew South | PC | PC | 12,666 | 46.56% | 1,081 | 3.97% | 77.62% | 12,666 | 11,585 | 2,952 | – | – | 27,203 | ||
| St. Catharines | PC | Lib | 12,392 | 38.89% | 723 | 2.27% | 60.91% | 11,669 | 12,392 | 7,556 | – | 247 | 31,864 | ||
| Sarnia | Lib | Lib | 11,500 | 38.97% | 257 | 0.87% | 63.42% | 11,243 | 11,500 | 6,770 | – | – | 29,513 | ||
| Sault Ste. Marie | PC | PC | 19,209 | 55.28% | 7,549 | 21.73% | 69.64% | 19,209 | 3,715 | 11,660 | – | 162 | 34,746 | ||
| Simcoe Centre | PC | PC | 15,876 | 44.25% | 5,434 | 15.15% | 68.40% | 15,876 | 9,556 | 10,442 | – | – | 35,874 | ||
| Simcoe East | PC | PC | 13,793 | 44.74% | 3,539 | 11.48% | 69.47% | 13,793 | 6,783 | 10,254 | – | – | 30,830 | ||
| Stormont—Dundas—Glengarry | PC | PC | 10,533 | 49.15% | 2,422 | 11.30% | 68.28% | 10,533 | 8,111 | 2,788 | – | – | 21,432 | ||
| Sudbury | NDP | NDP | 11,117 | 41.62% | 2,632 | 9.85% | 62.39% | 8,485 | 6,778 | 11,117 | – | 330 | 26,710 | ||
| Sudbury East | NDP | NDP | 15,991 | 55.19% | 8,990 | 31.03% | 63.84% | 7,001 | 5,984 | 15,991 | – | – | 28,976 | ||
| Temiskaming | NDP | PC | 9,578 | 47.95% | 664 | 3.32% | 69.48% | 9,578 | 1,481 | 8,914 | – | – | 19,973 | ||
| Victoria—Haliburton | Lib | Lib | 15,218 | 53.27% | 4,679 | 16.38% | 75.15% | 10,539 | 15,218 | 2,809 | – | – | 28,566 | ||
| Waterloo North | Lib | Lib | 13,556 | 49.43% | 5,540 | 20.20% | 62.16% | 8,016 | 13,556 | 5,851 | – | – | 27,423 | ||
| Welland-Thorold | NDP | NDP | 12,704 | 46.32% | 2,315 | 8.44% | 69.58% | 10,389 | 4,335 | 12,704 | – | – | 27,428 | ||
| Wellington—Dufferin—Peel | PC | PC | 14,272 | 45.83% | 4,641 | 14.90% | 67.42% | 14,272 | 9,631 | 7,235 | – | – | 31,138 | ||
| Wellington South | Lib | Lib | 16,212 | 50.52% | 8,326 | 25.95% | 67.27% | 7,667 | 16,212 | 7,886 | – | 325 | 32,090 | ||
| Wentworth | NDP | NDP | 15,332 | 59.80% | 9,826 | 38.33% | 65.29% | 5,506 | 4,800 | 15,332 | – | – | 25,638 | ||
| Wentworth North | Lib | Lib | 18,322 | 53.98% | 9,858 | 29.04% | 71.18% | 8,464 | 18,322 | 7,157 | – | – | 33,943 | ||
| Windsor—Riverside | NDP | NDP | 12,947 | 45.59% | 2,375 | 8.36% | 60.71% | 4,878 | 10,572 | 12,947 | – | – | 28,397 | ||
| Windsor—Sandwich | NDP | NDP | 9,711 | 51.36% | 3,687 | 19.50% | 50.98% | 2,838 | 6,024 | 9,711 | – | 334 | 18,907 | ||
| Windsor—Walkerville | Lib | Lib | 11,233 | 53.09% | 6,391 | 30.20% | 57.03% | 4,842 | 11,233 | 4,565 | 162 | 357 | 21,159 | ||
| York Centre | Lib | Lib | 17,735 | 45.53% | 2,768 | 7.11% | 66.52% | 14,967 | 17,735 | 6,247 | – | – | 38,949 | ||
| York North | PC | PC | 15,639 | 48.05% | 5,979 | 18.37% | 64.38% | 15,639 | 7,247 | 9,660 | – | – | 32,546 | ||
| Armourdale | Lib | PC | 14,082 | 42.67% | 2,433 | 7.37% | 68.16% | 14,082 | 11,649 | 6,736 | 258 | 280 | 33,005 | ||
| Beaches—Woodbine | NDP | NDP | 11,491 | 46.51% | 2,274 | 9.20% | 64.90% | 9,217 | 3,579 | 11,491 | – | 420 | 24,707 | ||
| Bellwoods | NDP | NDP | 6,177 | 47.77% | 2,845 | 22.00% | 62.80% | 2,925 | 3,332 | 6,177 | 151 | 346 | 12,931 | ||
| Don Mills | PC | PC | 17,005 | 55.20% | 8,880 | 28.82% | 61.14% | 17,005 | 4,906 | 8,125 | – | 772 | 30,808 | ||
| Dovercourt | NDP | NDP | 7,340 | 48.30% | 3,157 | 20.77% | 64.62% | 4,183 | 3,162 | 7,340 | – | 513 | 15,198 | ||
| Downsview | NDP | NDP | 10,194 | 45.10% | 4,042 | 17.88% | 65.26% | 6,152 | 5,814 | 10,194 | 193 | 251 | 22,604 | ||
| Eglinton | PC | PC | 19,213 | 59.60% | 11,742 | 36.42% | 68.38% | 19,213 | 7,471 | 4,857 | 315 | 382 | 32,238 | ||
| Etobicoke | NDP | NDP | 11,637 | 45.99% | 4,848 | 19.16% | 64.36% | 6,789 | 6,363 | 11,637 | – | 517 | 25,306 | ||
| High Park—Swansea | NDP | NDP | 10,409 | 40.86% | 779 | 3.06% | 66.53% | 9,630 | 4,897 | 10,409 | – | 537 | 25,473 | ||
| Humber | PC | PC | 19,888 | 50.95% | 9,316 | 23.87% | 69.10% | 19,888 | 10,572 | 7,781 | – | 793 | 39,034 | ||
| Lakeshore | NDP | NDP | 13,252 | 49.76% | 5,295 | 19.88% | 62.39% | 7,957 | 4,781 | 13,252 | – | 643 | 26,633 | ||
| Oakwood | NDP | NDP | 9,214 | 43.48% | 2,835 | 13.38% | 64.98% | 6,379 | 5,046 | 9,214 | 170 | 382 | 21,191 | ||
| Oriole | PC | PC | 14,194 | 44.32% | 4,487 | 14.01% | 64.42% | 14,194 | 9,707 | 6,737 | 1,109 | 282 | 32,029 | ||
| Parkdale | NDP | NDP | 7,574 | 44.12% | 2,440 | 14.21% | 61.81% | 4,116 | 5,134 | 7,574 | – | 343 | 17,167 | ||
| Riverdale | NDP | NDP | 9,639 | 55.79% | 5,350 | 30.97% | 56.51% | 4,289 | 2,821 | 9,639 | 117 | 410 | 17,276 | ||
| St. Andrew—St. Patrick | PC | PC | 11,128 | 49.38% | 2,977 | 13.21% | 64.40% | 11,128 | 2,895 | 8,151 | – | 360 | 22,534 | ||
| St. David | PC | PC | 11,894 | 44.14% | 836 | 3.10% | 69.76% | 11,894 | 3,794 | 11,058 | – | 202 | 26,948 | ||
| St. George | Lib | Lib | 10,116 | 36.71% | 428 | 1.55% | 60.90% | 9,688 | 10,116 | 6,287 | 975 | 494 | 27,560 | ||
| Scarborough Centre | PC | PC | 11,583 | 44.76% | 2,799 | 10.82% | 64.00% | 11,583 | 5,274 | 8,784 | – | 238 | 25,879 | ||
| Scarborough East | PC | PC | 14,792 | 50.91% | 7,524 | 25.89% | 63.01% | 14,792 | 6,508 | 7,268 | – | 489 | 29,057 | ||
| Scarborough—Ellesmere | NDP | NDP | 10,625 | 40.52% | 1,551 | 5.92% | 63.77% | 9,074 | 6,320 | 10,625 | – | 201 | 26,220 | ||
| Scarborough North | PC | PC | 20,988 | 50.11% | 10,685 | 25.51% | 64.21% | 20,988 | 10,303 | 9,868 | – | 721 | 41,880 | ||
| Scarborough West | NDP | NDP | 13,350 | 54.03% | 6,444 | 26.08% | 63.81% | 6,906 | 3,837 | 13,350 | 172 | 442 | 24,707 | ||
| Wilson Heights | Lib | PC | 11,430 | 41.97% | 2,993 | 10.99% | 62.93% | 11,430 | 7,195 | 8,437 | – | 174 | 27,236 | ||
| York East | PC | PC | 14,131 | 46.72% | 5,797 | 19.17% | 67.55% | 14,131 | 7,126 | 8,334 | – | 654 | 30,245 | ||
| York Mills | PC | PC | 21,795 | 58.45% | 12,183 | 32.67% | 66.55% | 21,795 | 9,612 | 5,051 | 465 | 368 | 37,291 | ||
| York South | NDP | NDP | 14,178 | 50.56% | 6,512 | 23.22% | 65.86% | 7,666 | 5,332 | 14,178 | – | 864 | 28,040 | ||
| York West | PC | PC | 16,538 | 46.25% | 6,088 | 17.03% | 67.89% | 16,538 | 10,450 | 8,510 | – | 260 | 35,758 | ||
| Yorkview | NDP | NDP | 13,326 | 52.49% | 6,823 | 26.87% | 58.59% | 4,105 | 6,503 | 13,326 | 608 | 846 | 25,388 | ||
- ↑ including spoilt ballots
- ↑ order is as given in EO reports
- ↑ T. Patrick Reid was the incumbent
- = open seat
- = turnout is above provincial average
- = winning candidate was in previous Legislature
- = not incumbent; was previously elected to the Legislature
- = incumbent had switched allegiance
- = incumbency arose from byelection gain
- = previously incumbent in another riding
- = Liberal-Labour candidate
- = other incumbents renominated
- = multiple candidates
Analysis
| Party in 1st place | Party in 2nd place | Total | |||
|---|---|---|---|---|---|
| PC | Lib | NDP | |||
| Progressive Conservative | 31 | 27 | 58 | ||
| Liberal | 30 | 3 | 33 | ||
| Liberal–Labour | 1 | 1 | |||
| New Democratic | 26 | 7 | 33 | ||
| Total | 57 | 38 | 30 | 125 | |
| Parties | 1st | 2nd | 3rd | 4th | 5th |
|---|---|---|---|---|---|
| █ Progressive Conservative | 58 | 57 | 10 | ||
| █ Liberal | 33 | 38 | 52 | ||
| █ New Democratic | 33 | 30 | 68 | ||
| █ Liberal–Labour | 1 | 1 | |||
| █ Communist | 23 | 8 | |||
| █ Libertarian | 19 | 9 | |||
| █ Independent | 13 | 6 | |||
| █ Social Credit | 6 | 1 | |||
| █ Democrat | 1 |
| Source | Party | |||||
|---|---|---|---|---|---|---|
| PC | Lib | LL | NDP | Total | ||
| Seats retained | Incumbents returned | 45 | 27 | 1 | 31 | 104 |
| Open seats held | 4 | 4 | 1 | 9 | ||
| Ouster of incumbent changing allegiance | 1 | 1 | ||||
| Seats changing hands | Incumbents defeated | 7 | 1 | 8 | ||
| Open seats gained | 2 | 1 | 3 | |||
| Total | 58 | 33 | 1 | 33 | 125 | |
Seats changing hands
Eleven seats changed allegiance in this election:
|
|
MPPs elected by region and riding
Party designations are as follows:
|
|
|
See also
References
- ↑ The Representation Amendment Act, 1976, S.O. 1976 (2nd Session), c. 6
- 1 2 3 4 5 6 "1975 general election results". Elections Ontario. Retrieved November 1, 2023.
Further reading
- Saywell, John, ed. (1980). Canadian annual review of politics and public affairs. 1977. Toronto: University of Toronto Press. ISBN 978-1-4426-7192-8.
| General elections | |
|---|---|
| By-elections | |
| Municipal elections | |
| Referendums | |