| |||||||||||||||||||||||||||||||||||||||||||||
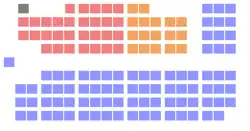
130 seats in the 36th Legislative Assembly of Ontario 66 seats needed for a majority | |||||||||||||||||||||||||||||||||||||||||||||
|---|---|---|---|---|---|---|---|---|---|---|---|---|---|---|---|---|---|---|---|---|---|---|---|---|---|---|---|---|---|---|---|---|---|---|---|---|---|---|---|---|---|---|---|---|---|
| Turnout | 63.00% ( | ||||||||||||||||||||||||||||||||||||||||||||
| |||||||||||||||||||||||||||||||||||||||||||||
 Popular vote by riding. As this is an FPTP election, seat totals are not determined by popular vote, but instead via results by each riding. Click the map for more details. | |||||||||||||||||||||||||||||||||||||||||||||
| |||||||||||||||||||||||||||||||||||||||||||||
The 1995 Ontario general election was held on June 8, 1995, to elect members of the 36th Legislative Assembly of the province of Ontario, Canada. The writs for the election were dropped on April 28, 1995.
The governing New Democratic Party, led by Premier Bob Rae, was defeated by voters, who were angry with the actions of the Rae government, such as its unpopular hiring quotas and the Social Contract legislation in 1993.[2] These policies caused the NDP to lose much of its base in organized labour, further reducing support for the party. At the 1993 federal election, the NDP tumbled to less than seven percent support, and lost all 11 of its federal seats in Ontario. By the time the writs were dropped for the 1995 provincial election, it was obvious that the NDP would not be reelected.
Riding name change
Acts were passed in 1991 and 1993, providing for the following name changes to ridings:
Campaign
The Liberal Party under Lyn McLeod had been leading in the polls for most of the period from 1992 to 1995, and were generally favoured to benefit from the swing in support away from the NDP. However, the party hurt its credibility through a series of high-profile policy reversals in the period leading up to the election. The most notable of these occurred when McLeod withdrew Liberal support from the Equality Rights Statute Amendment Act (Bill 167) introduced by the NDP government in 1994, which would have provided same-sex couples with rights and obligations mostly equal to those of opposite-sex common law couples and introduced a form of civil unions. Her decision was seen as cynical and opportunistic in light of the Liberals' earlier rural by-election loss in the socially conservative riding of Victoria—Haliburton. This gave the McLeod Liberals a reputation for "flip-flopping" and inconsistency while offending its socially progressive supporters.
The Progressive Conservative Party, led by Mike Harris, found success with its Common Sense Revolution campaign to cut personal income taxes, social assistance (welfare) rates, and government spending dramatically. Roughly half of his party's seats came from the more affluent regions of the Greater Toronto Area (GTA), especially the suburban belt surrounding Metro Toronto, often called the '905' for its telephone area code.
In addition, by presenting himself as a populist, representing "ordinary Ontarians" over "special interests", Harris was able to build Tory support among working-class voters. Although there were regional variations, many working-class voters shifted directly from the NDP to the Tories during the election, enabling the latter to win formerly NDP ridings such as Cambridge and Oshawa.
The televised party leaders' debate is often regarded as the turning point of the campaign. During the event, McLeod further alienated many voters with an overly aggressive performance. Harris used his time to speak directly to the camera to convey his party's Common Sense Revolution platform, virtually ignoring all questions asked of him by Rae and McLeod and avoiding getting caught up in their debate. Since Liberal support was regarded by many political insiders as soft and unsteady, many voters who were previously leaning to the Liberals shifted to the Progressive Conservatives after the debate.
Opinion polls
| Polling firm | Last day of survey |
Source | PCO | OLP | ONDP | Other | ME | Sample | |
|---|---|---|---|---|---|---|---|---|---|
| Election 1995 | June 8, 1995 | 44.8 | 31.1 | 20.6 | 3.5 | ||||
| Gallup | June 4, 1995 | [6] | 42 | 35 | 20 | — | 3.1 | — | |
| Angus Reid | May 1995 | [7] | 44 | 34 | 20 | — | 3.2 | 1,000 | |
| Angus Reid | May 1995 | [7] | 41 | 36 | 21 | — | 3.2 | 1,000 | |
| May 24, 1995 | [8] | 37 | 33 | ~25 | — | — | 400 | ||
| Compas | May 1995 | [9] | 36 | 40 | 21 | — | 4.5 | 507 | |
| Environics | May 1995 | [10] | 26 | 52 | 17 | — | 3 | — | |
| Election called (April 28, 1995)[11] | |||||||||
During the 35th Parliament of Ontario
| Polling firm | Last day of survey |
Source | PCO | OLP | ONDP | Other | ME | Sample |
|---|---|---|---|---|---|---|---|---|
| Angus Reid | April 1995 | [11] | 28 | 46 | 21 | — | — | — |
| Comquest Research | March 1995 | [12] | 30 | 34 | 36 | — | — | — |
| Angus Reid | January 1990 | [13] | 27 | 45 | 20 | 9 | 4.5 | 1,007 |
| Environics | June 25, 1992 | [14] | 28 | 42 | 25 | — | 3.2 | 1,000 |
| Environics | March 1992 | [14] | 28 | 43 | 23 | — | — | — |
| Environics | June 1991 | [15] | 23 | 36 | 34 | — | — | — |
| Environics | December 30, 1990 | [16] | 15 | 24 | 58 | — | 3.2 | 1,030 |
| Environics | October 1990 | [17] | 18 | 27 | 51 | — | 3.2 | 1,007 |
| Election 1990 | September 6, 1990 | 23.5 | 32.4 | 37.6 | 6.5 |
Results
Summary
The Progressive Conservatives won a majority while the Liberals finished with less support than they had in the 1990 election. The NDP, despite improving their standing in some Northern Ontario ridings, were heavily defeated, falling to 17 seats and third party status. The New Democrats would remain the third party until 2018 when they returned to Official Opposition status. McLeod and Rae resigned their party leadership posts not long after the campaign. It was also the worst result for an incumbent Ontario governing party up to that time and would remain so until 2018 when the NDP finally surpassed the then-governing Liberals.
One independent candidate was elected: Peter North in the riding of Elgin. North had been elected in 1990 as a New Democrat, but left the NDP and declared his intention to run as a Progressive Conservative. The PC Party did not accept him as a candidate, however.
At least five unregistered parties fielded candidates in this election, appearing on the ballot as independents:
- The Reform Association of Ontario ran fifteen candidates. Their leader was Kimble Ainslie. An article of The Globe and Mail for August 19, 1995 indicates that the party won 6,400 votes.
- John Steele campaigned as a candidate of the Communist League.
- The Ontario Renewal Party ran a number of candidates under the leadership of Diane Johnston. This was the Marxist–Leninist party under a different name.
- Amani Oakley and Joe Flexer ran as "Independent Labour" candidates in Toronto with the support of dissident or former members of the Ontario New Democratic Party and with the support of OPSEU in the case of Oakley and the Canadian Auto Workers in the case of Flexer .
- John Turmel's Abolitionist Party ran at least two candidates.
Overall
| Political party | Party leader | MPPs | Votes | |||||||
|---|---|---|---|---|---|---|---|---|---|---|
| Candidates | 1990 | 1995 | ± | # | ± | % | ± (pp) | |||
| Progressive Conservative | Mike Harris | 130 | 20 | 82 | 62 | 1,870,110 | 925,546 | 44.97% | 21.46 | |
| Liberal | Lyn McLeod | 130 | 36 | 30 | 6 | 1,291,326 | 10,808 | 31.05% | 1.35 | |
| New Democratic | Bob Rae | 130 | 74 | 17 | 57 | 854,163 | 655,343 | 20.54% | 17.03 | |
| Independent | 60 | – | 1 | 1 | 33,077 | 19,770 | 0.80% | 0.46 | ||
| Family Coalition | Donald Pennell | 55 | – | – | – | 61,657 | 49,174 | 1.48% | 1.28 | |
| Natural Law | Ron Parker | 68 | – | – | – | 18,326 | 18,326 | 0.44% | New | |
| Green | Frank de Jong | 37 | – | – | – | 14,108 | 15,989 | 0.34% | 0.41 | |
| Libertarian | John Shadbolt | 18 | – | – | – | 6,085 | (18,528 | 0.15% | 0.47 | |
| Freedom | Jack Plant | 12 | – | – | – | 4,532 | 1,483 | 0.11% | 0.04 | |
| Confederation of Regions | 6 | – | – | – | 3,971 | 71,902 | 0.10% | 1.79 | ||
| Communist | Darrell Rankin | 5 | – | – | – | 1,015 | 124 | 0.02% | – | |
| Total | 651 | 130 | 130 | 4,158,370 | 100.00% | |||||
| Rejected ballots | 42,152 | 10,423 |
||||||||
| Voter turnout | 4,200,522 | 129,868 |
63.00 | 1.45 | ||||||
| Registered electors | 6,667,798 | 351,849 |
||||||||
| Party | Seats | Votes | Change (pp) | ||
|---|---|---|---|---|---|
| █ Progressive Conservative | 82 / 130 | 44.97% | 21.46 | ||
| █ Liberal | 30 / 130 | 31.05% | -1.35 | ||
| █ New Democratic | 17 / 130 | 20.54% | -17.03 | ||
| █ Independent | 1 / 130 | 0.80% | 0.46 | ||
| █ Family Coalition | 0 / 130 | 1.48% | -1.28 | ||
| █ Confederation of Regions | 0 / 130 | 0.10% | -1.79 | ||
| █ Other | 0 / 130 | 1.06% | -0.47 | ||
Synopsis of results
| Riding | Winning party | Turnout [a 1] |
Votes[a 2] | |||||||||||||
|---|---|---|---|---|---|---|---|---|---|---|---|---|---|---|---|---|
| Name[a 3][a 4] | 1990 | Party | Votes | Share | Margin # |
Margin % |
PC | Lib | NDP | FCP | Ind | Other | Total | |||
| Algoma | NDP | NDP | 6,190 | 44.47% | 1,588 | 11.41% | 64.02% | 4,602 | 3,128 | 6,190 | – | – | – | 13,920 | ||
| Algoma—Manitoulin | Lib | Lib | 7,238 | 46.96% | 2,054 | 13.33% | 59.33% | 5,184 | 7,238 | 2,991 | – | – | – | 15,413 | ||
| Beaches—Woodbine | NDP | NDP | 10,862 | 42.44% | 2,939 | 11.48% | 67.14% | 7,923 | 6,158 | 10,862 | – | 319 | 331 | 25,593 | ||
| Brampton North | Lib | PC | 20,148 | 49.47% | 5,348 | 13.13% | 59.17% | 20,148 | 14,800 | 5,288 | – | – | 494 | 40,730 | ||
| Brampton South | Lib | PC | 21,859 | 49.67% | 6,622 | 15.05% | 59.78% | 21,859 | 15,237 | 5,676 | 1,011 | – | 229 | 44,012 | ||
| Brantford | NDP | PC | 13,745 | 41.01% | 3,327 | 9.93% | 59.90% | 13,745 | 10,418 | 8,165 | 762 | – | 430 | 33,520 | ||
| Brant—Haldimand | Lib | PC | 14,184 | 47.81% | 3,595 | 12.12% | 61.67% | 14,184 | 10,589 | 3,030 | 1,340 | – | 527 | 29,670 | ||
| Bruce | Lib | PC | 13,680 | 42.70% | 2,676 | 8.35% | 69.34% | 13,680 | 11,004 | 4,269 | 2,787 | – | 296 | 32,036 | ||
| Burlington South | PC | PC | 24,831 | 72.56% | 19,416 | 56.73% | 69.20% | 24,831 | 5,415 | 3,507 | 470 | – | – | 34,223 | ||
| Cambridge | NDP | PC | 17,269 | 46.93% | 5,472 | 14.87% | 59.56% | 17,269 | 5,606 | 11,797 | 1,690 | 433 | – | 36,795 | ||
| Carleton | PC | PC | 28,349 | 64.96% | 18,606 | 42.64% | 62.05% | 28,349 | 9,743 | 4,046 | 942 | – | 558 | 43,638 | ||
| Carleton East | Lib | Lib | 17,780 | 48.19% | 4,209 | 11.41% | 60.34% | 13,571 | 17,780 | 4,783 | – | – | 758 | 36,892 | ||
| Chatham—Kent | NDP | PC | 10,461 | 36.29% | 546 | 1.89% | 58.54% | 10,461 | 9,915 | 7,444 | 1,008 | – | – | 28,828 | ||
| Cochrane North | NDP | NDP | 6,935 | 45.62% | 1,983 | 13.04% | 58.96% | 3,316 | 4,952 | 6,935 | – | – | – | 15,203 | ||
| Cochrane South | NDP | NDP | 12,114 | 52.45% | 5,527 | 23.93% | 60.36% | 6,587 | 4,058 | 12,114 | – | 339 | – | 23,098 | ||
| Cornwall | Lib | Lib | 14,507 | 59.70% | 6,669 | 27.44% | 55.53% | 7,838 | 14,507 | 1,719 | – | – | 236 | 24,300 | ||
| Don Mills | NDP | PC | 14,897 | 53.36% | 7,290 | 26.11% | 66.09% | 14,897 | 7,607 | 4,569 | – | 362 | 484 | 27,919 | ||
| Dovercourt | NDP | NDP | 9,049 | 47.23% | 3,488 | 18.20% | 63.22% | 3,560 | 5,561 | 9,049 | – | 261 | 730 | 19,161 | ||
| Downsview | NDP | Lib | 9,142 | 39.48% | 360 | 1.55% | 63.90% | 4,444 | 9,142 | 8,782 | – | 572 | 217 | 23,157 | ||
| Dufferin—Peel | PC | PC | 23,239 | 66.00% | 14,738 | 41.86% | 65.37% | 23,239 | 8,501 | 3,470 | – | – | – | 35,210 | ||
| Durham Centre | NDP | PC | 25,107 | 58.34% | 15,299 | 35.55% | 65.02% | 25,107 | 9,808 | 8,120 | – | – | – | 43,035 | ||
| Durham East | NDP | PC | 24,303 | 61.79% | 15,784 | 40.13% | 63.79% | 24,303 | 6,512 | 8,519 | – | – | – | 39,334 | ||
| Durham West | NDP | PC | 29,232 | 54.58% | 15,258 | 28.49% | 63.83% | 29,232 | 13,974 | 9,444 | – | 904 | – | 53,554 | ||
| Durham—York | NDP | PC | 25,018 | 60.40% | 16,970 | 40.97% | 63.45% | 25,018 | 7,512 | 8,048 | 845 | – | – | 41,423 | ||
| Eglinton | Lib | PC | 17,496 | 48.82% | 4,592 | 12.81% | 73.65% | 17,496 | 12,904 | 4,597 | – | 123 | 720 | 35,840 | ||
| Elgin | NDP | Ind | 12,436 | 37.79% | 1,776 | 5.40% | 61.17% | 10,660 | 5,801 | 3,445 | – | 12,436 | 565 | 32,907 | ||
| Essex-Kent | NDP | Lib | 10,130 | 37.01% | 1,746 | 6.38% | 58.85% | 8,384 | 10,130 | 7,837 | 1,022 | – | – | 27,373 | ||
| Essex South | Lib | Lib | 14,513 | 54.48% | 8,783 | 32.97% | 50.91% | 5,730 | 14,513 | 4,348 | 1,550 | – | 498 | 26,639 | ||
| Etobicoke—Humber | Lib | PC | 18,128 | 51.26% | 4,494 | 12.71% | 73.35% | 18,128 | 13,634 | 3,100 | – | 308 | 196 | 35,366 | ||
| Etobicoke—Lakeshore | NDP | PC | 14,879 | 45.23% | 5,805 | 17.65% | 66.55% | 14,879 | 9,074 | 8,279 | – | 186 | 479 | 32,897 | ||
| Etobicoke—Rexdale | NDP | PC | 9,521 | 36.57% | 853 | 3.28% | 59.51% | 9,521 | 7,173 | 8,668 | – | 488 | 188 | 26,038 | ||
| Etobicoke West | PC | PC | 18,349 | 55.30% | 8,523 | 25.69% | 70.68% | 18,349 | 9,826 | 4,608 | – | – | 399 | 33,182 | ||
| Fort William | Lib | Lib | 15,681 | 57.32% | 8,565 | 31.31% | 63.29% | 7,116 | 15,681 | 4,561 | – | – | – | 27,358 | ||
| Fort York | NDP | NDP | 10,762 | 41.02% | 2,280 | 8.69% | 64.86% | 6,025 | 8,482 | 10,762 | – | 269 | 699 | 26,237 | ||
| Frontenac—Addington | NDP | PC | 12,211 | 38.52% | 1,962 | 6.19% | 62.52% | 12,211 | 10,249 | 7,302 | 1,404 | 416 | 121 | 31,703 | ||
| Grey—Owen Sound | PC | PC | 25,138 | 63.21% | 16,876 | 42.44% | 65.58% | 25,138 | 8,262 | 3,413 | 2,082 | 703 | 170 | 39,768 | ||
| Guelph | NDP | PC | 17,204 | 42.55% | 5,745 | 14.21% | 66.31% | 17,204 | 11,459 | 10,278 | 1,035 | 187 | 265 | 40,428 | ||
| Halton Centre | Lib | PC | 30,621 | 61.41% | 16,644 | 33.38% | 69.06% | 30,621 | 13,977 | 5,268 | – | – | – | 49,866 | ||
| Halton North | NDP | PC | 19,247 | 60.90% | 12,679 | 40.12% | 66.58% | 19,247 | 6,568 | 4,362 | 1,239 | – | 187 | 31,603 | ||
| Hamilton Centre | NDP | NDP | 8,012 | 36.81% | 690 | 3.17% | 54.71% | 5,723 | 7,322 | 8,012 | 376 | – | 331 | 21,764 | ||
| Hamilton East | NDP | Lib | 11,088 | 43.55% | 4,046 | 15.89% | 57.85% | 6,263 | 11,088 | 7,042 | 681 | – | 389 | 25,463 | ||
| Hamilton Mountain | NDP | PC | 13,852 | 36.60% | 1,028 | 2.72% | 64.41% | 13,852 | 12,824 | 9,837 | 1,329 | – | – | 37,842 | ||
| Hamilton West | NDP | PC | 13,301 | 40.54% | 4,034 | 12.29% | 67.00% | 13,301 | 8,911 | 9,267 | 880 | – | 453 | 32,812 | ||
| Hastings—Peterborough | NDP | PC | 16,187 | 54.17% | 7,859 | 26.30% | 67.44% | 16,187 | 4,056 | 8,328 | 1,002 | – | 308 | 29,881 | ||
| High Park—Swansea | NDP | PC | 10,559 | 38.77% | 1,660 | 6.10% | 70.36% | 10,559 | 7,121 | 8,899 | – | – | 654 | 27,233 | ||
| Huron | NDP | PC | 13,343 | 46.16% | 6,334 | 21.91% | 70.00% | 13,343 | 7,009 | 6,927 | 1,418 | 207 | – | 28,904 | ||
| Kenora | Lib | Lib | 9,152 | 53.72% | 4,055 | 23.80% | 52.02% | 5,097 | 9,152 | 2,788 | – | – | – | 17,037 | ||
| Kingston and the Islands | NDP | Lib | 10,314 | 36.90% | 1,743 | 6.24% | 61.08% | 8,571 | 10,314 | 8,052 | 858 | – | 155 | 27,950 | ||
| Kitchener | NDP | PC | 13,374 | 40.15% | 3,382 | 10.15% | 60.12% | 13,374 | 9,992 | 6,998 | 2,111 | 835 | – | 33,310 | ||
| Kitchener—Wilmot | NDP | PC | 17,392 | 45.70% | 7,286 | 19.14% | 59.07% | 17,392 | 10,106 | 8,146 | 2,415 | – | – | 38,059 | ||
| Lake Nipigon | NDP | NDP | 5,079 | 42.99% | 1,616 | 13.68% | 54.99% | 3,273 | 3,463 | 5,079 | – | – | – | 11,815 | ||
| Lambton | NDP | PC | 12,034 | 43.58% | 4,109 | 14.88% | 64.70% | 12,034 | 7,925 | 5,055 | 2,184 | – | 417 | 27,615 | ||
| Lanark—Renfrew | PC | PC | 19,959 | 55.79% | 10,003 | 27.96% | 59.87% | 19,959 | 9,956 | 3,455 | 745 | 557 | 1,104 | 35,776 | ||
| Lawrence | Lib | Lib | 11,784 | 45.88% | 3,829 | 14.91% | 65.08% | 7,955 | 11,784 | 5,000 | – | – | 944 | 25,683 | ||
| Leeds—Grenville | PC | PC | 21,763 | 63.27% | 12,808 | 37.23% | 63.06% | 21,763 | 8,955 | 2,316 | – | 438 | 927 | 34,399 | ||
| Lincoln | NDP | PC | 18,709 | 50.68% | 7,833 | 21.22% | 68.09% | 18,709 | 10,876 | 5,800 | 1,241 | – | 288 | 36,914 | ||
| London Centre | NDP | NDP | 11,096 | 36.77% | 1,732 | 5.74% | 53.26% | 9,364 | 7,559 | 11,096 | 1,041 | – | 1,119 | 30,179 | ||
| London North | PC | PC | 23,195 | 52.65% | 12,083 | 27.43% | 64.73% | 23,195 | 11,112 | 8,167 | 777 | – | 800 | 44,051 | ||
| London South | NDP | PC | 18,161 | 44.35% | 7,432 | 18.15% | 61.88% | 18,161 | 10,693 | 10,729 | 387 | 323 | 653 | 40,946 | ||
| Markham | PC | PC | 37,314 | 64.81% | 26,544 | 46.10% | 62.80% | 37,314 | 10,770 | 7,779 | 1,088 | – | 626 | 57,577 | ||
| Middlesex | NDP | PC | 15,684 | 40.35% | 5,236 | 13.47% | 64.67% | 15,684 | 10,448 | 8,799 | 3,481 | – | 458 | 38,870 | ||
| Mississauga East | Lib | PC | 16,468 | 52.07% | 6,429 | 20.33% | 60.38% | 16,468 | 10,039 | 5,120 | – | – | – | 31,627 | ||
| Mississauga North | Lib | PC | 22,095 | 47.76% | 4,414 | 9.54% | 57.37% | 22,095 | 17,681 | 5,283 | – | – | 1,206 | 46,265 | ||
| Mississauga South | PC | PC | 23,116 | 69.76% | 17,565 | 53.01% | 65.39% | 23,116 | 5,551 | 3,282 | – | 596 | 590 | 33,135 | ||
| Mississauga West | Lib | PC | 26,614 | 46.21% | 3,339 | 5.80% | 60.33% | 26,614 | 23,275 | 6,758 | – | – | 952 | 57,599 | ||
| Muskoka—Georgian Bay | NDP | PC | 17,864 | 51.79% | 9,769 | 28.32% | 65.50% | 17,864 | 8,095 | 7,742 | – | 381 | 411 | 34,493 | ||
| Nepean | Lib | PC | 17,510 | 49.66% | 3,935 | 11.16% | 64.97% | 17,510 | 13,575 | 3,274 | – | – | 901 | 35,260 | ||
| Niagara Falls | NDP | PC | 12,132 | 43.33% | 3,843 | 13.73% | 59.48% | 12,132 | 8,289 | 7,034 | – | 189 | 355 | 27,999 | ||
| Niagara South | NDP | PC | 8,815 | 38.24% | 1,181 | 5.12% | 60.14% | 8,815 | 7,634 | 5,376 | 536 | 688 | – | 23,049 | ||
| Nickel Belt | NDP | NDP | 8,007 | 46.54% | 2,458 | 14.29% | 64.70% | 3,305 | 5,549 | 8,007 | – | 225 | 119 | 17,205 | ||
| Nipissing | PC | PC | 18,722 | 60.48% | 10,837 | 35.01% | 63.68% | 18,722 | 7,885 | 4,350 | – | – | – | 30,957 | ||
| Norfolk | NDP | PC | 17,335 | 48.68% | 7,922 | 22.24% | 64.14% | 17,335 | 9,413 | 7,893 | 972 | – | – | 35,613 | ||
| Northumberland | Lib | PC | 19,359 | 52.14% | 6,126 | 16.50% | 67.13% | 19,359 | 13,233 | 4,539 | – | – | – | 37,131 | ||
| Oakville South | PC | PC | 21,689 | 63.34% | 13,210 | 38.58% | 71.08% | 21,689 | 8,479 | 2,973 | 1,103 | – | – | 34,244 | ||
| Oakwood | NDP | Lib | 8,599 | 42.31% | 975 | 4.80% | 65.74% | 3,298 | 8,599 | 7,624 | – | 301 | 504 | 20,326 | ||
| Oriole | Lib | Lib | 11,164 | 43.70% | 1,034 | 4.05% | 68.39% | 10,130 | 11,164 | 3,665 | – | 243 | 342 | 25,544 | ||
| Oshawa | NDP | PC | 16,793 | 54.33% | 8,343 | 26.99% | 57.66% | 16,793 | 5,666 | 8,450 | – | – | – | 30,909 | ||
| Ottawa Centre | NDP | Lib | 11,150 | 39.26% | 1,712 | 6.03% | 63.88% | 6,715 | 11,150 | 9,438 | – | 173 | 924 | 28,400 | ||
| Ottawa East | Lib | Lib | 14,436 | 56.94% | 9,068 | 35.77% | 53.21% | 5,368 | 14,436 | 4,818 | – | 136 | 596 | 25,354 | ||
| Ottawa—Rideau | Lib | PC | 14,796 | 45.11% | 1,523 | 4.64% | 61.29% | 14,796 | 13,273 | 4,138 | – | – | 590 | 32,797 | ||
| Ottawa South | Lib | Lib | 15,418 | 53.35% | 6,800 | 23.53% | 66.51% | 8,618 | 15,418 | 4,235 | – | – | 628 | 28,899 | ||
| Ottawa West | Lib | Lib | 14,516 | 45.48% | 1,618 | 5.07% | 64.43% | 12,898 | 14,516 | 3,718 | – | 241 | 544 | 31,917 | ||
| Oxford | NDP | PC | 17,568 | 49.48% | 8,067 | 22.72% | 64.02% | 17,568 | 6,564 | 9,501 | 1,061 | – | 809 | 35,503 | ||
| Parkdale | Lib | Lib | 8,435 | 47.87% | 2,640 | 14.98% | 64.03% | 2,887 | 8,435 | 5,795 | – | – | 505 | 17,622 | ||
| Parry Sound | PC | PC | 15,523 | 65.47% | 10,702 | 45.14% | 63.57% | 15,523 | 4,821 | 3,367 | – | – | – | 23,711 | ||
| Perth | NDP | PC | 13,735 | 44.81% | 5,290 | 17.26% | 62.90% | 13,735 | 7,722 | 8,445 | – | 326 | 427 | 30,655 | ||
| Peterborough | NDP | PC | 22,735 | 52.66% | 12,409 | 28.74% | 66.23% | 22,735 | 10,326 | 7,581 | 2,064 | – | 464 | 43,170 | ||
| Port Arthur | NDP | Lib | 14,281 | 48.92% | 6,791 | 23.26% | 61.91% | 6,554 | 14,281 | 7,490 | 683 | 182 | – | 29,190 | ||
| Prescott and Russell | Lib | Lib | 24,808 | 55.68% | 11,171 | 25.07% | 56.64% | 13,637 | 24,808 | 4,472 | – | 564 | 1,072 | 44,553 | ||
| Prince Edward—Lennox—South Hastings | NDP | PC | 14,144 | 49.61% | 6,346 | 22.26% | 60.04% | 14,144 | 7,798 | 5,996 | – | – | 571 | 28,509 | ||
| Quinte | Lib | PC | 13,961 | 47.28% | 2,135 | 7.23% | 58.79% | 13,961 | 11,826 | 3,743 | – | – | – | 29,530 | ||
| Rainy River | NDP | NDP | 4,912 | 39.93% | 205 | 1.67% | 63.98% | 4,707 | 2,683 | 4,912 | – | – | – | 12,302 | ||
| Renfrew North | Lib | Lib | 16,044 | 53.32% | 6,363 | 21.15% | 61.00% | 9,681 | 16,044 | 2,483 | 1,695 | – | 187 | 30,090 | ||
| Riverdale | NDP | NDP | 10,948 | 46.88% | 4,600 | 19.70% | 64.66% | 6,348 | 5,443 | 10,948 | – | 273 | 341 | 23,353 | ||
| St. Andrew—St. Patrick | NDP | PC | 13,092 | 40.43% | 3,679 | 11.36% | 67.16% | 13,092 | 9,413 | 9,231 | – | – | 649 | 32,385 | ||
| St. Catharines | Lib | Lib | 13,761 | 46.53% | 2,275 | 7.69% | 64.58% | 11,486 | 13,761 | 3,929 | 245 | – | 153 | 29,574 | ||
| St. Catharines—Brock | NDP | PC | 11,976 | 47.02% | 4,603 | 18.07% | 62.56% | 11,976 | 7,373 | 5,521 | 598 | – | – | 25,468 | ||
| St. George—St. David | Lib | PC | 10,662 | 33.87% | 337 | 1.07% | 70.61% | 10,662 | 10,325 | 9,672 | – | 424 | 392 | 31,475 | ||
| Sarnia | NDP | PC | 9,260 | 33.81% | 634 | 2.31% | 61.31% | 9,260 | 8,626 | 7,487 | 1,642 | 376 | – | 27,391 | ||
| Sault Ste. Marie | NDP | NDP | 15,392 | 43.33% | 3,720 | 10.47% | 62.24% | 7,699 | 11,672 | 15,392 | – | – | 757 | 35,520 | ||
| Scarborough—Agincourt | Lib | Lib | 13,472 | 46.08% | 2,135 | 7.30% | 61.37% | 11,337 | 13,472 | 4,112 | – | – | 313 | 29,234 | ||
| Scarborough Centre | NDP | PC | 12,717 | 45.88% | 5,554 | 20.04% | 63.35% | 12,717 | 7,163 | 6,841 | – | 649 | 349 | 27,719 | ||
| Scarborough East | NDP | PC | 19,166 | 55.72% | 11,954 | 34.75% | 64.69% | 19,166 | 7,197 | 7,212 | – | 270 | 553 | 34,398 | ||
| Scarborough—Ellesmere | NDP | PC | 13,282 | 47.89% | 5,376 | 19.38% | 64.95% | 13,282 | 5,602 | 7,906 | – | – | 947 | 27,737 | ||
| Scarborough North | Lib | Lib | 15,507 | 46.08% | 4,999 | 14.85% | 58.67% | 10,508 | 15,507 | 6,431 | 369 | – | 840 | 33,655 | ||
| Scarborough West | NDP | PC | 11,773 | 43.13% | 2,557 | 9.37% | 64.33% | 11,773 | 5,326 | 9,216 | – | 254 | 730 | 27,299 | ||
| Simcoe Centre | NDP | PC | 29,790 | 58.25% | 17,729 | 34.67% | 63.06% | 29,790 | 12,061 | 7,655 | 769 | 284 | 580 | 51,139 | ||
| Simcoe East | PC | PC | 23,489 | 60.97% | 14,445 | 37.50% | 66.52% | 23,489 | 9,044 | 4,849 | – | 876 | 266 | 38,524 | ||
| Simcoe West | PC | PC | 24,346 | 68.24% | 18,847 | 52.83% | 63.01% | 24,346 | 5,499 | 4,937 | 894 | – | – | 35,676 | ||
| S-D-G & East Grenville | PC | PC | 18,884 | 64.69% | 11,290 | 38.68% | 62.48% | 18,884 | 7,594 | 2,285 | – | – | 428 | 29,191 | ||
| Sudbury | NDP | Lib | 12,349 | 40.66% | 3,651 | 12.02% | 62.10% | 8,093 | 12,349 | 8,698 | – | 629 | 605 | 30,374 | ||
| Sudbury East | NDP | NDP | 11,236 | 37.09% | 1,642 | 5.42% | 62.30% | 8,680 | 9,594 | 11,236 | – | 473 | 310 | 30,293 | ||
| Timiskaming | Lib | Lib | 8,643 | 46.78% | 2,458 | 13.30% | 64.13% | 6,185 | 8,643 | 2,962 | – | – | 685 | 18,475 | ||
| Victoria—Haliburton | NDP | PC | 25,267 | 68.42% | 18,987 | 51.41% | 66.16% | 25,267 | 6,280 | 4,210 | 378 | 643 | 151 | 36,929 | ||
| Waterloo North | PC | PC | 25,757 | 59.42% | 17,028 | 39.29% | 62.32% | 25,757 | 8,729 | 6,869 | 1,714 | – | 275 | 43,344 | ||
| Welland-Thorold | NDP | NDP | 12,848 | 42.71% | 4,218 | 14.02% | 65.22% | 8,089 | 8,630 | 12,848 | – | – | 517 | 30,084 | ||
| Wellington | PC | PC | 21,753 | 66.70% | 16,047 | 49.20% | 65.00% | 21,753 | 5,706 | 4,104 | 782 | – | 269 | 32,614 | ||
| Wentworth East | NDP | PC | 15,888 | 44.50% | 3,606 | 10.10% | 64.56% | 15,888 | 12,282 | 6,667 | – | 863 | – | 35,700 | ||
| Wentworth North | NDP | PC | 21,165 | 55.65% | 10,772 | 28.32% | 70.97% | 21,165 | 10,393 | 6,474 | – | – | – | 38,032 | ||
| Willowdale | PC | PC | 18,834 | 53.99% | 8,964 | 25.70% | 68.94% | 18,834 | 9,870 | 4,825 | – | 715 | 639 | 34,883 | ||
| Wilson Heights | Lib | Lib | 12,468 | 44.64% | 2,696 | 9.65% | 62.76% | 9,772 | 12,468 | 4,612 | 231 | 109 | 741 | 27,933 | ||
| Windsor—Riverside | NDP | NDP | 12,347 | 45.70% | 2,935 | 10.86% | 54.02% | 4,440 | 9,412 | 12,347 | 459 | – | 362 | 27,020 | ||
| Windsor—Sandwich | NDP | Lib | 11,940 | 47.12% | 5,526 | 21.81% | 50.11% | 5,704 | 11,940 | 6,414 | 610 | 410 | 263 | 25,341 | ||
| Windsor—Walkerville | NDP | Lib | 10,281 | 41.28% | 380 | 1.53% | 52.54% | 3,610 | 10,281 | 9,901 | 957 | – | 156 | 24,905 | ||
| York Centre | Lib | PC | 37,897 | 48.94% | 8,747 | 11.30% | 60.80% | 37,897 | 29,150 | 6,698 | 1,891 | – | 1,792 | 77,428 | ||
| York East | NDP | PC | 12,789 | 41.65% | 3,263 | 10.63% | 69.59% | 12,789 | 7,398 | 9,526 | – | 748 | 243 | 30,704 | ||
| York Mills | PC | PC | 18,852 | 63.58% | 11,534 | 38.90% | 69.31% | 18,852 | 7,318 | 2,930 | – | – | 553 | 29,653 | ||
| York—Mackenzie | Lib | PC | 25,904 | 58.33% | 11,931 | 26.86% | 67.21% | 25,904 | 13,973 | 3,611 | 498 | – | 425 | 44,411 | ||
| York South | NDP | NDP | 10,442 | 41.24% | 2,716 | 10.73% | 69.13% | 7,726 | 6,025 | 10,442 | 305 | 170 | 653 | 25,321 | ||
| Yorkview | NDP | Lib | 9,245 | 46.97% | 2,798 | 14.22% | 60.99% | 3,989 | 9,245 | 6,447 | – | – | – | 19,681 | ||
- = open seat
- = turnout is above provincial average
- = winning candidate was in previous Legislature
- = not incumbent; was previously elected to the Legislature
- = incumbent had switched allegiance
- = incumbency arose from byelection gain
- = previously incumbent in another riding
- = other incumbents renominated
- = previously an MP in the House of Commons of Canada
- = multiple candidates
Analysis
| Party in 1st place | Party in 2nd place | Total | |||
|---|---|---|---|---|---|
| PC | Lib | NDP | |||
| Progressive Conservative | 67 | 15 | 82 | ||
| Liberal | 20 | 10 | 30 | ||
| New Democratic | 7 | 10 | 17 | ||
| Independent | 1 | 1 | |||
| Total | 28 | 77 | 25 | 130 | |
| Parties | 1st | 2nd | 3rd | 4th | 5th |
|---|---|---|---|---|---|
| █ Progressive Conservative | 82 | 28 | 20 | ||
| █ Liberal | 30 | 77 | 23 | ||
| █ New Democratic | 17 | 25 | 87 | 1 | |
| █ Independent | 1 | 20 | 20 | ||
| █ Family Coalition | 50 | 4 | |||
| █ Green | 15 | 16 | |||
| █ Natural Law | 12 | 32 | |||
| █ Confederation of Regions | 5 | ||||
| █ Libertarian | 4 | 8 | |||
| █ Freedom | 4 | 4 | |||
| █ Communist | 3 |
| Source | Party | |||||
|---|---|---|---|---|---|---|
| PC | Lib | NDP | Ind | Total | ||
| Seats retained | Incumbents returned | 19 | 18 | 17 | 54 | |
| Open seats held | 1 | 1 | 2 | |||
| Seats changing hands | Incumbents defeated | 53 | 9 | 62 | ||
| Open seats gained | 7 | 2 | 9 | |||
| Byelection gain held | 2 | 2 | ||||
| Incumbent changing allegiance | 1 | 1 | ||||
| Total | 82 | 30 | 17 | 1 | 130 | |
MPPs elected by region and riding
Party designations are as follows:
|
|
|
See also
References
- 1 2 3 4 5 6 "1995 general election results". Elections Ontario. Retrieved December 22, 2023.
- ↑ Bakan, Abigail (2003). "Ontario: Lessons of the Rise and Fall of Employment Equity Legislation from the Perspective of Rights Advocacy". ResearchGate – via ResearchGate.
- ↑ Representation Amendment Act, 1991, S.O. 1991, c. 2
- ↑ Representation Amendment Act, 1993, S.O. 1993, c. 6
- ↑ Representation Amendment Act, 1993 (No. 2), S.O. 1993, c. 30
- ↑ "Harris confident he'll become premier after today's vote: Poll shows Tories holding lead in final week with NDP in third". The Globe and Mail. June 8, 1995. p. A13.
- 1 2 Campbell, Murray; Mittselstaedt, Martin (June 5, 1995). "Harris lays out legislative timetable: Polls suggest Tory majority". The Globe and Mail. p. A1.
- ↑ "Tories ahead in new NDP poll: Liberal Party says it still has the lead". The Globe and Mail. May 16, 1995. p. A8.
- ↑ Rusk, James (May 24, 1995). "Tories' rise pleases Rae: Poll indicates sharp Grit fall". The Globe and Mail. p. A1.
- ↑ Rusk, James (May 15, 1995). "Race watchers hope debate will jolt yawners: Many voters delay final choice because they already know which party they don't want". The Globe and Mail. p. A10.
- 1 2 Mittelstaedt, Martin (April 29, 1995). "Rae calls June 8 Ontario election: Raucous campaign predicted as parties face quirky voters seeking solutions on jobs, deficit". The Globe and Mail. p. A1.
- ↑ Rusk, James (April 1, 1995). "NDP hastens to exploit opportunity offered by McLeod". The Globe and Mail. p. A7.
- ↑ "Liberals keep lead in polls". The Globe and Mail. January 26, 1995. p. A6.
- 1 2 "NDP slumps to third spot, survey shows: Advisers finger auto insurance, Sunday shopping and Martel scandal for slide in popularity". The Globe and Mail. July 7, 1992. p. A6.
- ↑ Allen, Gene (September 3, 1991). "Ontario New Democrats take stock". The Globe and Mail. p. A4.
- ↑ "NDP support up sharply, poll finds". The Globe and Mail. January 19, 1991. p. A4.
- ↑ Allen, Gene (October 24, 1990). "Will hold NDP to its promises, Nixon pledges: Vows Liberals won't be obstructive". The Globe and Mail. p. A8.
| General elections | |
|---|---|
| By-elections | |
| Municipal elections | |
| Referendums | |