 Geographic distribution of the White British in 2021 (in England and Wales) | |
| Total population | |
|---|---|
| White British 49,997,686 (2011)
| |
| Regions with significant populations | |
| 41,540,791 (73.5%) (2021)[1] | |
| 4,863,000 (91.8%) (2011)[2] | |
| 2,814,427 (90.9%) (2021)[1] | |
| Northern Ireland (including all White people reporting at least one of British/Irish/Northern Irish/English/Scottish/Welsh national identities) | 1,765,971 (92.8%) (2021)[3] |
| Languages | |
| Predominantly English Also: Welsh, Scottish Gaelic, Irish, Scots, Ulster Scots, Cornish, Manx, British Sign Language | |
| Religion | |
| Christian (49.0%) Irreligious (43.9%) Jewish (0.4%) Muslim (0.2%) Others (0.6%) Unspecified (5.8%) Figures for England and Wales (2021) only[4] | |
White British is an ethnicity classification used for the native white population identifying as English, Scottish, Welsh, Cornish, Northern Irish, or British in the United Kingdom Census. In the 2011 census, the White British population was 49,997,686, 81.5% of Great Britain's total population. For the United Kingdom entirely, due to different reporting measures within Northern Ireland which includes all those who identified as British with those who identified as Irish, an amalgamated total of 52,320,080 including those who identified as White Irish in Great Britain is given making up 82.8% of the population.[1][2][5]
Census classifications
For the 2011 census, in England and Wales, the White self-classification option included a subcategory of "English/Welsh/Scottish/Northern Irish/British".[6][7] In Scotland, the White category included "Scottish" and "Other British" options.[8] In Northern Ireland, the White British classification did not appear, the only choice being 'White'.[9]
The 2011 census for England, Wales and Scotland also included additional White ethnic classifications of White Irish, White Gypsy/Irish Traveller and White Other. There were calls for the 2011 national census in England and Wales to include an extra subcategory so people could identify their ethnic group as Cornish.[10][11]

Demographics
Population and distribution

The White British census classification have their ages more evenly distributed in their population pyramid and have the highest per cent female population of all ethnic-based classifications. The following numbers were based on the 2011 census conducted in each country. In England and Wales, about 64 per cent of the White British classification are between the ages of 16 and 64 while about 18 per cent are under 16 and 19 per cent are over 64. All other census classifications have a higher percentage of their population under 16 and a lower percentage over 64. Of those aged 65 or over, White British are 8 per cent male and 10 per cent female, making them have the lowest per cent male population among all census classifications defined as "ethnic" in the census.[12]
In Scotland, about 65 per cent of the White British classification are between the ages of 16 and 64 while about 17 per cent are under 16 and 18 per cent are over 64. Of those aged 65 or over, White British are 8 per cent male and 10 per cent female, the same percentages as in England and Wales.[13]
In Northern Ireland, about 13 per cent of the White classification are between the ages of 16 and 24 while about 21 per cent are under 16 and 65 per cent are over 24. Of those aged 25 or over, white people are 32 per cent male and 34 per cent female.[14]
According to the 2011 UK Census results, White British people made up the largest percentage of the population in rural areas, such as Allerdale (99.4%) and Copeland (99.3%) in Cumbria, Ryedale (99.4%) in North Yorkshire, North Norfolk (99.2%) and North Devon (99%). Cities across the UK regions with high White British populations included Swansea (91.5%), Kingston Upon Hull (89.7%), Plymouth (92.2%), Darlington (93.7%), Belfast (96.4% - NI classification "white"),[15] Norwich (84.7%), Liverpool (84.8%) and Chelmsford (90.0%). The highest unitary authority with a White British proportion was Redcar and Cleveland (97.6%) followed by Northumberland (97.2%), Hartlepool and County Durham (both 96.6%). The highest county was Lincolnshire (93%) followed by Nottinghamshire, Norfolk and Worcestershire, all above 92%. Within the London region, Havering had the highest White British percentage with 83.3%, followed by Bromley with 77.4%, Bexley with 77.3% and Richmond upon Thames with 71.4%.[1]
Since the 2011 UK Census was returned, London contained by far the lowest percentage of English and other White British people of all the UK regions, where they made up less than half of the population in 24 of the 32 boroughs, including: Newham (16.7%), Brent (18.0%), Ealing (30.4%), Harrow (30.9%), Tower Hamlets (31.2%), Westminster (35.2%) and Hackney (36.2%). Despite this, the White British population in London was still higher in numbers than the entirety of Wales or Northern Ireland, owing to London's high overall population. The city with the lowest White British population as a percentage was Leicester (45.1%) - also the only city below 50% without counting Westminster - while the lowest for unitary authorities was Slough (34.5%), followed by Luton (44.6%).[1] The local ward with the lowest percentage was Southall Broadway in Ealing (3.5%), followed by Southall Green in Ealing; Green Street East, Green Street West, and East Ham North, all in Newham, which were the only wards below five per cent.
| United Kingdom NUTS 1 Region's | Year | |||||
|---|---|---|---|---|---|---|
| 2001[16][17][18] | 2011[1][2][5] | 2021[19][20] | ||||
| Number | Percentage | Number | Percentage | Number | Percentage | |
| Northern Ireland[t 1] | 1,670,988 | 99.1% | 1,738,604 | 97.7% | 1,765,971 | 92.8% |
| 4,832,756 | 95.4% | 4,863,000 | 91.9% | |||
| 2,786,605 | 96% | 2,855,450 | 93.2% | 2,814,427 | 90.9% | |
| 42,747,136 | 87% | 42,279,236 | 79.8% | 41,540,791 | 73.5% | |
| North East England | 2,425,592 | 96.4% | 2,431,423 | 93.6% | 2,397,557 | 90.6% |
| South West England | 4,701,602 | 95.3% | 4,855,676 | 91.8% | 5,008,149 | 87.8% |
| North West England | 6,203,043 | 92.1% | 6,141,069 | 87.1% | 6,019,385 | 81.2% |
| Yorkshire and the Humber | 4,551,394 | 91.6% | 4,531,137 | 85.8% | 4,431,265 | 80.9% |
| East of England | 4,927,343 | 91.4% | 4,986,170 | 85.3% | 4,972,149 | 78.5% |
| East Midlands | 3,807,731 | 91.2% | 3,871,146 | 85.4% | 3,882,390 | 79.6% |
| South East England | 7,304,678 | 91.3% | 7,358,998 | 85.2% | 7,315,058 | 78.8% |
| West Midlands | 4,537,892 | 86.1% | 4,434,333 | 79.2% | 4,275,557 | 71.8% |
| Greater London | 4,287,861 | 59.7% | 3,669,284 | 44.9% | 3,239,281 | 36.8% |
| Overall in the United Kingdom:[t 2] | 52,728,717
(50,366,497[t 3]) |
89.7%
(88.2%) |
52,320,080
(49,997,686[t 4]) |
82.8%
(81.5%) |
||
- ↑ Figure includes all those who identified with British/Irish/Welsh/English/Scottish and Northern Irish and is White.
- ↑ Figure not in bracket includes White Irish figures, to make Great Britain data and Northern Ireland data comparable over time due to different reporting measures.
- ↑ Excluding Northern Irish figures entirely, only including those for White British in Great Britain
- ↑ Excluding Northern Irish figures entirely, only including those for White British in Great Britain
- White British mapped out in local authorities
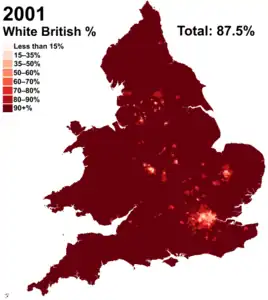 2001 (87.5%)
 2011
2011- 2021 (74.4%)
Population by local authority
| Local Authority District (England and Wales) | 2021[21] | |
|---|---|---|
| Total | % | |
| Allerdale | 92,981 | 96.7 |
| Copeland | 64,851 | 96.7 |
| Staffordshire Moorlands | 92,567 | 96.6 |
| Redcar and Cleveland | 131,789 | 96.5 |
| Isle of Anglesey | 66,339 | 96.3 |
| Caerphilly | 169,356 | 96.2 |
| Northumberland | 308,015 | 96.1 |
| Torridge | 65,452 | 96.1 |
| Barrow-in-Furness | 64,485 | 95.7 |
| North East Derbyshire | 97,657 | 95.7 |
| Wyre | 107,171 | 95.7 |
| East Lindsey | 136,036 | 95.6 |
| North Norfolk | 98,403 | 95.6 |
| Hambleton | 86,678 | 95.6 |
| Blaenau Gwent | 63,990 | 95.6 |
| Derbyshire Dales | 68,326 | 95.5 |
| Torfaen | 87,873 | 95.2 |
| Rhondda Cynon Taf | 226,123 | 95.1 |
| Hartlepool | 87,761 | 95.0 |
| Amber Valley | 119,934 | 95.0 |
| Ryedale | 51,963 | 95.0 |
| Neath Port Talbot | 135,111 | 95.0 |
| Teignbridge | 127,937 | 94.9 |
| West Devon | 54,196 | 94.9 |
| Powys | 126,357 | 94.9 |
| Eden | 51,891 | 94.8 |
| High Peak | 86,183 | 94.8 |
| County Durham | 494,638 | 94.7 |
| Forest of Dean | 82,401 | 94.7 |
| Pembrokeshire | 116,816 | 94.7 |
| Bridgend | 137,755 | 94.7 |
| East Riding of Yorkshire | 323,838 | 94.6 |
| West Lindsey | 89,964 | 94.5 |
| Cannock Chase | 95,019 | 94.5 |
| Denbighshire | 90,470 | 94.4 |
| North Devon | 92,944 | 94.3 |
| North Kesteven | 111,304 | 94.3 |
| Craven | 53,690 | 94.3 |
| East Devon | 142,011 | 94.2 |
| South Hams | 83,481 | 94.2 |
| Monmouthshire | 87,566 | 94.2 |
| Ribble Valley | 57,916 | 94.1 |
| Conwy | 107,926 | 94.1 |
| Maldon | 62,268 | 94.0 |
| Mid Suffolk | 96,581 | 94.0 |
| Carmarthenshire | 176,673 | 94.0 |
| Dorset | 356,270 | 93.9 |
| Selby | 86,380 | 93.9 |
| Isle of Wight | 131,697 | 93.8 |
| South Lakeland | 97,960 | 93.8 |
| Mid Devon | 77,699 | 93.8 |
| Rochford | 80,339 | 93.8 |
| Isles of Scilly | 1,926 | 93.7 |
| Scarborough | 101,848 | 93.7 |
| Halton | 120,301 | 93.6 |
| Cornwall | 533,882 | 93.6 |
| Broadland | 123,265 | 93.6 |
| Babergh | 86,418 | 93.6 |
| St. Helens | 171,546 | 93.6 |
| Tendring | 138,604 | 93.5 |
| Shropshire | 301,918 | 93.3 |
| Bolsover | 74,852 | 93.3 |
| Malvern Hills | 74,197 | 93.3 |
| Gwynedd | 109,548 | 93.3 |
| Merthyr Tydfil | 54,916 | 93.3 |
| Havant | 115,732 | 93.2 |
| New Forest | 163,847 | 93.2 |
| North Warwickshire | 60,598 | 93.2 |
| Flintshire | 144,356 | 93.2 |
| Chesterfield | 96,392 | 93.1 |
| Fylde | 75,793 | 93.1 |
| East Suffolk | 229,063 | 93.1 |
| Chorley | 109,449 | 93.0 |
| South Tyneside | 137,429 | 93.0 |
| Melton | 48,064 | 92.9 |
| Sunderland | 254,655 | 92.9 |
| Fareham | 106,212 | 92.8 |
| South Ribble | 103,089 | 92.8 |
| West Lancashire | 108,998 | 92.8 |
| Carlisle | 102,004 | 92.7 |
| North East Lincolnshire | 145,362 | 92.6 |
| Castle Point | 82,997 | 92.6 |
| Barnsley | 226,488 | 92.6 |
| Erewash | 104,400 | 92.5 |
| Gosport | 75,763 | 92.5 |
| Richmondshire | 46,027 | 92.5 |
| Wyre Forest | 93,961 | 92.5 |
| North Tyneside | 193,303 | 92.5 |
| Stroud | 111,896 | 92.4 |
| Knowsley | 142,698 | 92.4 |
| Wirral | 295,967 | 92.4 |
| South Staffordshire | 101,832 | 92.2 |
| Torbay | 128,375 | 92.1 |
| North West Leicestershire | 96,430 | 92.1 |
| Cotswold | 83,545 | 92.0 |
| Bassetlaw | 108,338 | 92.0 |
| Lichfield | 97,952 | 92.0 |
| Vale of Glamorgan | 121,371 | 92.0 |
| Ceredigion | 65,674 | 91.9 |
| Wealden | 146,968 | 91.8 |
| South Norfolk | 130,292 | 91.8 |
| Ashfield | 115,972 | 91.8 |
| Mendip | 106,608 | 91.8 |
| Wigan | 302,482 | 91.8 |
| Sefton | 256,327 | 91.8 |
| Rother | 85,362 | 91.7 |
| South Somerset | 158,325 | 91.7 |
| Cheshire West and Chester | 325,620 | 91.2 |
| Sedgemoor | 114,340 | 91.2 |
| Herefordshire, County of | 170,419 | 91.1 |
| Rutland | 37,372 | 91.0 |
| Newark and Sherwood | 111,939 | 91.0 |
| Tamworth | 71,456 | 90.9 |
| Hinckley and Bosworth | 103,225 | 90.8 |
| Harrogate | 147,479 | 90.7 |
| Wrexham | 122,547 | 90.7 |
| Wychavon | 120,048 | 90.6 |
| East Hampshire | 113,814 | 90.5 |
| South Kesteven | 129,741 | 90.5 |
| Somerset West and Taunton | 142,560 | 90.5 |
| Blackpool | 127,445 | 90.4 |
| North Somerset | 195,915 | 90.4 |
| Braintree | 140,283 | 90.4 |
| Rossendale | 64,073 | 90.4 |
| Bromsgrove | 89,676 | 90.4 |
| Stockton-on-Tees | 177,526 | 90.3 |
| Darlington | 97,320 | 90.3 |
| Tewkesbury | 85,720 | 90.3 |
| Dover | 105,111 | 90.3 |
| Gateshead | 177,131 | 90.3 |
| Wiltshire | 459,594 | 90.1 |
| South Derbyshire | 96,634 | 90.1 |
| Stratford-on-Avon | 121,330 | 90.1 |
| Chichester | 111,822 | 90.1 |
| Newcastle-under-Lyme | 110,947 | 90.0 |
| Stafford | 123,203 | 90.0 |
| Cheshire East | 357,337 | 89.6 |
| Plymouth | 236,802 | 89.5 |
| West Oxfordshire | 101,648 | 89.0 |
| Lewes | 88,830 | 88.9 |
| Uttlesford | 81,245 | 88.9 |
| Great Yarmouth | 88,663 | 88.9 |
| Adur | 57,390 | 88.9 |
| King's Lynn and West Norfolk | 136,966 | 88.8 |
| North Lincolnshire | 150,554 | 88.7 |
| Breckland | 125,516 | 88.7 |
| Arun | 146,178 | 88.7 |
| Swale | 134,385 | 88.6 |
| Tonbridge and Malling | 116,787 | 88.3 |
| Rotherham | 234,613 | 88.3 |
| Wakefield | 311,634 | 88.2 |
| Warrington | 185,940 | 88.1 |
| Eastleigh | 120,242 | 88.1 |
| Winchester | 112,304 | 88.1 |
| Horsham | 129,348 | 88.1 |
| Test Valley | 114,873 | 88.0 |
| Folkestone and Hythe | 96,590 | 88.0 |
| Lancaster | 125,552 | 87.8 |
| Harborough | 85,474 | 87.6 |
| Swansea | 208,703 | 87.5 |
| York | 176,963 | 87.3 |
| Thanet | 122,796 | 87.3 |
| Mansfield | 96,475 | 87.3 |
| Hart | 86,414 | 86.9 |
| Waverley | 111,321 | 86.8 |
| Doncaster | 266,879 | 86.6 |
| East Cambridgeshire | 75,897 | 86.5 |
| Rushcliffe | 102,479 | 86.1 |
| Fenland | 88,028 | 85.9 |
| South Gloucestershire | 249,160 | 85.8 |
| South Oxfordshire | 127,890 | 85.8 |
| Mole Valley | 74,983 | 85.8 |
| Mid Sussex | 130,971 | 85.8 |
| Bath and North East Somerset | 165,478 | 85.6 |
| West Berkshire | 138,253 | 85.6 |
| Sevenoaks | 103,116 | 85.6 |
| Gedling | 100,367 | 85.6 |
| Huntingdonshire | 154,089 | 85.2 |
| Hastings | 77,418 | 85.1 |
| Worthing | 94,680 | 85.0 |
| East Hertfordshire | 127,245 | 84.7 |
| Broxtowe | 93,718 | 84.5 |
| South Holland | 80,244 | 84.4 |
| Tunbridge Wells | 97,049 | 84.2 |
| Kingston upon Hull, City of | 223,962 | 83.9 |
| Central Bedfordshire | 245,769 | 83.5 |
| Tandridge | 73,343 | 83.5 |
| Stockport | 245,831 | 83.4 |
| Cheltenham | 98,932 | 83.3 |
| Vale of White Horse | 115,517 | 83.2 |
| Chelmsford | 150,758 | 83.1 |
| Telford and Wrekin | 153,936 | 83.0 |
| Exeter | 108,095 | 82.7 |
| Brentwood | 63,696 | 82.7 |
| Lincoln | 85,891 | 82.7 |
| Worcester | 85,868 | 82.7 |
| Calderdale | 170,983 | 82.7 |
| Ashford | 109,673 | 82.6 |
| Canterbury | 129,887 | 82.5 |
| Bournemouth, Christchurch and Poole | 329,609 | 82.4 |
| Redditch | 71,742 | 82.4 |
| Tameside | 190,305 | 82.4 |
| Dudley | 266,564 | 82.4 |
| Blaby | 84,746 | 82.3 |
| West Suffolk | 147,935 | 82.2 |
| Eastbourne | 83,465 | 82.1 |
| Basildon | 154,045 | 82.1 |
| Maidstone | 144,114 | 82.0 |
| Basingstoke and Deane | 151,572 | 81.9 |
| Nuneaton and Bedworth | 109,807 | 81.8 |
| Southend-on-Sea | 147,442 | 81.6 |
| North Hertfordshire | 108,298 | 81.3 |
| Colchester | 155,488 | 80.7 |
| North Northamptonshire | 289,274 | 80.5 |
| Newport | 128,245 | 80.4 |
| South Cambridgeshire | 128,985 | 79.6 |
| Hyndburn | 65,471 | 79.6 |
| Middlesbrough | 114,421 | 79.5 |
| Dacorum | 122,107 | 78.7 |
| Stoke-on-Trent | 202,906 | 78.5 |
| Medway | 218,953 | 78.3 |
| East Staffordshire | 97,019 | 78.2 |
| Bury | 151,528 | 78.2 |
| Gloucester | 103,317 | 78.0 |
| Burnley | 73,752 | 77.9 |
| Charnwood | 143,345 | 77.9 |
| Cherwell | 125,422 | 77.9 |
| Surrey Heath | 70,473 | 77.9 |
| Solihull | 168,398 | 77.9 |
| Bracknell Forest | 96,950 | 77.8 |
| Portsmouth | 161,664 | 77.7 |
| Norwich | 111,623 | 77.6 |
| Guildford | 111,076 | 77.3 |
| Liverpool | 375,785 | 77.3 |
| Reigate and Banstead | 115,949 | 76.9 |
| Warwick | 112,650 | 75.9 |
| Epping Forest | 101,994 | 75.6 |
| Stevenage | 67,394 | 75.3 |
| West Northamptonshire | 319,509 | 75.1 |
| Rugby | 85,684 | 74.9 |
| Ipswich | 104,208 | 74.6 |
| Boston | 52,540 | 74.5 |
| Sheffield | 414,698 | 74.5 |
| Newcastle upon Tyne | 223,567 | 74.5 |
| Swindon | 173,231 | 74.2 |
| Elmbridge | 102,867 | 74.1 |
| Salford | 199,614 | 74.0 |
| Brighton and Hove | 204,831 | 73.9 |
| Cardiff | 266,533 | 73.6 |
| St Albans | 108,962 | 73.5 |
| Leeds | 595,737 | 73.4 |
| Harlow | 67,993 | 72.9 |
| Wokingham | 129,087 | 72.7 |
| Buckinghamshire | 401,489 | 72.6 |
| Runnymede | 63,965 | 72.6 |
| Trafford | 169,550 | 72.1 |
| Bristol, City of | 338,452 | 71.6 |
| Rushmoor | 70,917 | 71.1 |
| Kirklees | 305,579 | 70.5 |
| Rochdale | 156,669 | 70.0 |
| Epsom and Ewell | 56,136 | 69.4 |
| Spelthorne | 71,261 | 69.2 |
| Windsor and Maidenhead | 105,991 | 69.1 |
| Bolton | 203,486 | 68.8 |
| Broxbourne | 67,891 | 68.6 |
| Gravesham | 73,030 | 68.3 |
| Southampton | 169,481 | 68.1 |
| Three Rivers | 63,706 | 67.9 |
| Walsall | 191,529 | 67.4 |
| Dartford | 78,557 | 67.3 |
| Woking | 69,911 | 67.3 |
| Welwyn Hatfield | 80,551 | 67.2 |
| Bromley | 219,493 | 66.5 |
| Havering | 174,232 | 66.5 |
| Derby | 173,077 | 66.2 |
| Thurrock | 116,430 | 66.2 |
| Pendle | 63,320 | 66.1 |
| Preston | 97,715 | 66.1 |
| Oldham | 157,914 | 65.2 |
| Bexley | 158,842 | 64.4 |
| Bedford | 118,779 | 64.1 |
| Hertsmere | 68,032 | 63.1 |
| Richmond upon Thames | 123,093 | 63.0 |
| Milton Keynes | 178,568 | 62.2 |
| Crawley | 73,178 | 61.8 |
| Oadby and Wigston | 34,512 | 59.8 |
| Peterborough | 128,353 | 59.5 |
| Nottingham | 185,580 | 57.3 |
| Sutton | 120,014 | 57.2 |
| Blackburn with Darwen | 87,997 | 56.9 |
| Bradford | 309,912 | 56.7 |
| Coventry | 190,889 | 55.3 |
| Wolverhampton | 144,303 | 54.7 |
| Kingston upon Thames | 90,288 | 53.7 |
| Reading | 93,167 | 53.5 |
| Oxford | 86,672 | 53.5 |
| Cambridge | 77,195 | 53.0 |
| Sandwell | 177,929 | 52.1 |
| Manchester | 268,572 | 48.7 |
| Wandsworth | 157,048 | 48.0 |
| Watford | 46,820 | 45.8 |
| Birmingham | 491,211 | 42.9 |
| City of London | 3,649 | 42.5 |
| Greenwich | 119,665 | 41.4 |
| Merton | 88,673 | 41.2 |
| Islington | 86,092 | 39.7 |
| Hammersmith and Fulham | 70,105 | 38.3 |
| Lambeth | 119,395 | 37.6 |
| Croydon | 146,268 | 37.4 |
| Lewisham | 111,726 | 37.2 |
| Hillingdon | 113,377 | 37.1 |
| Barnet | 140,777 | 36.2 |
| Southwark | 109,253 | 35.5 |
| Camden | 74,348 | 35.4 |
| Waltham Forest | 94,766 | 34.0 |
| Hackney | 87,927 | 33.9 |
| Leicester | 122,395 | 33.2 |
| Kensington and Chelsea | 46,883 | 32.7 |
| Haringey | 84,298 | 31.9 |
| Luton | 71,532 | 31.8 |
| Enfield | 103,140 | 31.3 |
| Barking and Dagenham | 67,550 | 30.9 |
| Hounslow | 81,933 | 28.4 |
| Westminster | 57,162 | 28.0 |
| Ealing | 89,265 | 24.3 |
| Slough | 38,101 | 24.0 |
| Redbridge | 71,844 | 23.2 |
| Tower Hamlets | 71,177 | 22.9 |
| Harrow | 53,567 | 20.5 |
| Brent | 51,611 | 15.2 |
| Newham | 51,819 | 14.8 |
| Total | ||
| 44,355,218 | 74.4% | |
Population in metropolitan counties
- Population in counties in 2011


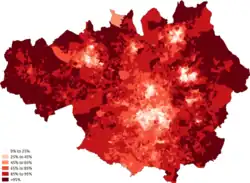 Greater Manchester (79.84% White British)
Population in city districts
- Population in city districts in 2011
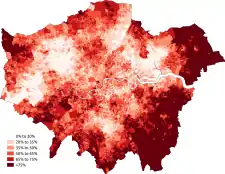 London (45.5% White British)
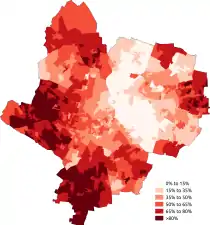 Leicester (45.06% White British)
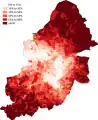 Birmingham (53.14% White British)
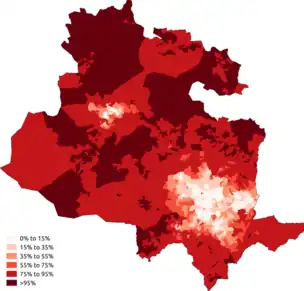 Bradford (63.86% White British)
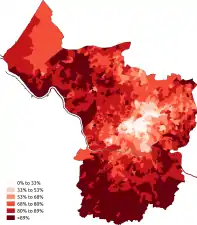 Bristol (77.86% White British)
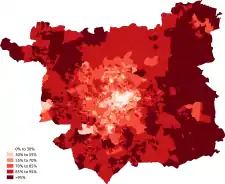 Leeds (81.13% White British)
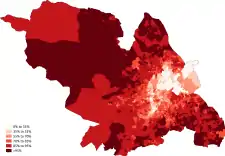 Sheffield (80.85% White British)
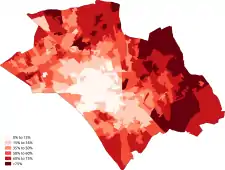 Luton (44.52% White British)
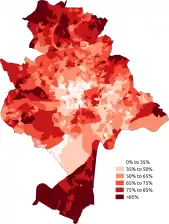 Nottingham (65.46% White British)
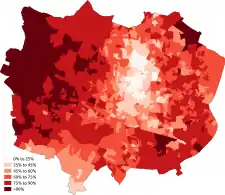 Coventry (66.63% White British)
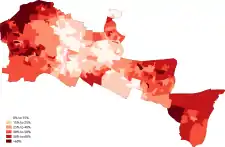 Slough (34.52% White British)
Population in school children


| Ethnic group | School year[22] | |
|---|---|---|
| 2021/2022 | ||
| Number | % | |
| White: Total | 6,011,045 | 71.4% |
| White: British | 5,379,748 | 63.9% |
Population in births
| Ethnic Group | Year | |||||||
|---|---|---|---|---|---|---|---|---|
| 2005[24] | 2011 | 2015 | 2019 | |||||
| Number | % | Number | % | Number | % | Number | % | |
| White: Total | 451,514 | 69.5%
(80.3%) |
536,021 | 74.49% | 507,829 | 72.29% | 452,248 | 70.67% |
| White: British | 418,052 | 64.4%
(75.2%[fn 1]) |
476,328 | 66.19% | 432,114 | 62.05% | 374,056 | 58.45% |
| Not Stated | 70,303 | 10.8% | 22,848 | 3.17% | 22,041 | 3.16% | 25,578 | 4.00% |
Economic status and education
According to official UK Government figures from 2016, the employment rate for White British people stood at 75%, with the overall employment rate in the UK standing at 74%.[25] UK Government figures also demonstrate that 31% of White British people work in professional and managerial occupations, higher than the Mixed (30%), Pakistani/Bangladeshi (27%) and Black (25%) groups, but lower than the Indian ethnic group (43%).[26]
At GCSE level, official UK Government statistics state that 63% of White British pupils attained A* to C grades in English and Mathematics in the 2015–16 academic year, higher than Black Caribbean (51%) and Pakistani (58%) pupils, but lower than Bangladeshi (67%), Indian (77%) and Chinese (83%) pupils.[27] According to a report by the Sutton Trust, "White working class pupils achieve the lowest grades at GCSE of any main ethnic group, with just a quarter of boys and a third of girls achieving 5 good GCSEs."[28] At A-Level, in the 2015–16 academic year, 11% of White British pupils achieved at least 3 'A' grades at A-Level; the only major ethnic groups to achieve the same benchmark at a higher rate were Indian (14%) and Chinese (24%) pupils.[29]
According to Department for Education statistics for the 2020-21 academic year, White British pupils attained slightly below the national average for academic performance at both A-Level and GCSE. 25.9% of White British pupils achieved at least 3 As at A Level[30] and an average score of 50.2 was achieved in Attainment 8 scoring at GCSE level.[31] White British pupils eligible for free school meals, a measurement of socioeconomic status, are found to be the largest disadvantaged group in education across the early years, GCSE performance and access to higher education.[32] Since 2007, out of all ethnicities aged 18 years old who have received a state education, white pupils have had the lowest rate of entry into higher education and have also seen the lowest rate of increase, from 21.8% in 2007 to 33.3% in 2021. For comparison, 72.1% of Chinese pupils and 48.6% of Black pupils gained a higher education place in the same year.[33]
|
|
| |||||||||||||||||||||||||||||||||||||||||||||||||||||||||||||||||||||
Religion
| Part of a series on the |
| Culture of the United Kingdom |
|---|
 |
Statistically, White British are more likely to be Christian than other ethnic-based classifications. According to the 2011 UK Census, White British are 64% Christian in England and Wales, mostly Anglican in England, while the percentage for all groups is about 59%. The percentage of White British who are Christians is lower in Scotland, at 55% (mainly Presbyterian there), whereas at least 54% of all Scots are Christian. The British country with the highest percentage is Northern Ireland, where white people are 94% Christian, while 93% of all usual residents are. About 27% of the White British population in England and Wales, and 36% in Scotland reported having "no religion". In Northern Ireland, the lowest percentage of white people who reported "no religion" in the census is about 5%. The 27% and 36% per cent figures for "no religion" are about the same for all groups. About 7% of the White British in England and Wales, and Scotland declined to state any religion.[35][36][37]
| Religion | England and Wales | |||||
|---|---|---|---|---|---|---|
| 2001[38] | 2011[35] | 2021[39] | ||||
| Number | % | Number | % | Number | % | |
| 34,576,389 | 75.9% | 28,738,688 | 63.7% | 21,747,631 | 49.0% | |
| No religion | 7,033,407 | 15.4% | 12,624,325 | 28% | 19,480,022 | 43.9% |
| 218,324 | 0.5% | 202,600 | 0.4% | 181,738 | 0.4% | |
| 63,042 | 0.1% | 77,272 | 0.2% | 90,939 | 0.2% | |
| 50,408 | 0.1% | 72,423 | 0.2% | 74,908 | 0.2% | |
| 5,820 | 0.0% | 6,909 | 0.0% | 5,145 | 0.0% | |
| 6,192 | 0.0% | 5,417 | 0.0% | 2,616 | 0.0% | |
| Not Stated | 3,471,290 | 7.6% | 3,238,911 | 7.2% | 2,575,113 | 5.8% |
| Other religions | 108,869 | 0.2% | 168,141 | 0.4% | 196,926 | 0.4% |
| Total | 45,533,741 | 100% | 45,134,686 | 100% | 44,355,038 | 100% |
See also
- Ethnic groups in the United Kingdom
- Demographics of the United Kingdom
- Demography of England
- Demographics of Scotland
- Demographics of Wales
- Demographics of Northern Ireland
- List of United Kingdom censuses
- Classification of ethnicity in the United Kingdom
- National Statistics Socio-economic Classification
- Genetic history of the British Isles
- Historical immigration to Great Britain
- List of English districts and their ethnic composition
Notes and references
Notes
- ↑ Report states that births in which no ethnicity was stated were usually White British. If assumptions about all non-stated births are actually White British, the percentage of the group rises to 75.2% of births in 2005 and 80.3% White overall.
References
- 1 2 3 4 5 6 7 United Kingdom census (2021). "Table KS201EW - Ethnic group, local authorities in England and Wales". Office for National Statistics. Retrieved 13 June 2014.
- 1 2 3 4 United Kingdom census (2011). "Ethnic groups, Scotland, 2001 and 2011 Scotlands Census published 30 September 2013" (PDF). National Records of Scotland. Retrieved 13 June 2014.
- ↑ "Ethnic Group - 5 Categories by National Identity - 17 Categories | NISRA Flexible Table Builder". build.nisra.gov.uk. Retrieved 25 June 2023.
- ↑ Ethnic group by religion Office for National Statistics. 28 March 2023. Retrieved on 28 March 2023.
- 1 2 United Kingdom census (2011). "Table DC2206NI - National Identity (Classification 1) by Ethnic Group". Northern Ireland Statistics and Research Agency. Retrieved 13 June 2014.
- ↑ 2011-2001 Census questionnaire comparability, Office for National Statistics, Accessed 28 December 2012
- ↑ Census 2011 Wales Household Questionnaire 2011, Accessed 28 December 2012
- ↑ Scotland's Census 2011 Household Questionnaire 2011 Archived 19 November 2012 at the Wayback Machine, Accessed 28 December 2012
- ↑ NISRA 2011 census Questionnaire Archived 14 December 2010 at the Wayback Machine, Accessed 28 December 2012
- ↑ "People urged to say they are 'Cornish' on census". BBC News. 21 March 2011.
- ↑ "2006 local govt abstracts". Archived from the original on 5 May 2009. Retrieved 23 August 2011.
- ↑ United Kingdom census (2011). "Table CT0476 - Sex by age by country of birth by ethnic group - England and Wales". Office of National Statistics.
- ↑ United Kingdom census (2011). "Table DC2101SC - Ethnic group by sex by age". National Records of Scotland.
- ↑ United Kingdom census (2011). "Table CT0392NI - Country of birth by ethnic group by age by sex". Northern Ireland Statistics and Research Agency.
- ↑ United Kingdom census (2011). "Table DC2201NI - Country of birth by ethnic group". Northern Ireland Statistics and Research Agency. Retrieved 8 October 2013.
- ↑ "Analysis of Ethnicity in the 2001 Census - Summary Report". www.gov.scot. 2001. Retrieved 7 January 2022.
- ↑ "Northern Ireland Neighbourhood Information Service". 2001.
- ↑ "Key Statistics in England and Wales". webarchive.nationalarchives.gov.uk. 2001. Retrieved 7 January 2022.
- ↑ "Ethnic group - Office for National Statistics". www.ons.gov.uk. Retrieved 29 November 2022.
- ↑ "Ethnic Group - 5 Categories by National Identity - 17 Categories". build.nisra.gov.uk. Retrieved 25 June 2023.
- ↑ "Ethnic group, England and Wales - Office for National Statistics".
- ↑ "Schools, pupils and their characteristics, Academic Year 2021/22". explore-education-statistics.service.gov.uk. Retrieved 9 September 2022.
- ↑ "Births and infant mortality by ethnicity, England and Wales". Retrieved 31 January 2022.
- ↑ "Birthweight and gestational age by ethnic group, England and Wales 2005: introducing new data on births" (PDF). 15 February 2009. Archived from the original (PDF) on 15 February 2009. Retrieved 22 August 2022.
- ↑ UK Government, "Ethnicity Facts and Figures: Work, pay and benefits: Employment" Archived 21 April 2018 at the Wayback Machine.
- ↑ UK Government, "Ethnicity Facts and Figures: Work, pay and benefits: Employment by Occupation" Archived 20 April 2018 at the Wayback Machine.
- ↑ UK Government, "Ethnicity Facts and Figures: Education, skills and training: A* to C in English and Maths GCSE attainment for children aged 14 to 16 (Key Stage 4)" Archived 21 April 2018 at the Wayback Machine, Accessed 17 July 2018.
- ↑ The Sutton Trust, "White working class boys have lowest GCSE Grades as disadvantaged Bangladeshi, African and Chinese pupils show dramatically improved results", 10 November 2016. Accessed 17 July 2018.
- ↑ UK Government, "Ethnicity Facts and Figures: Education, skills and training: Students aged 16 to 18 achieving 3 A grades or better at A Level" Archived 21 April 2018 at the Wayback Machine. Accessed 17 July 2018.
- 1 2 "Students getting 3 A grades or better at A level". gov.uk. Department for Education. 26 May 2022. Retrieved 26 May 2022.
- 1 2 "GCSE results (Attainment 8)". gov.uk. Department for Education. 18 March 2022. Retrieved 18 March 2022.
- ↑ "'Forgotten' White working-class pupils let down by decades of neglect, MPs say". committees.parliament.uk. Education Select Committee. Retrieved 22 June 2021.
- ↑ "Ethnicity facts and figures: Entry rates into higher education". service.gov.uk. Universities and Colleges Admissions Service. 9 March 2022.
- ↑ "GCSE English and maths results". gov.uk. Department for Education. 18 March 2022. Retrieved 18 March 2022.
- 1 2 United Kingdom census (2011). "Table DC2201EW - Ethnic group and religion". Office for National Statistics. Retrieved 14 January 2016. Size: 21 Kb.
- ↑ United Kingdom census (2011). "Table DC2201SC - Ethnic group by religion". National Records of Scotland.
- ↑ United Kingdom census (2011). "Table DC2248NI - Ethnicity and religion or religion brought up in". Northern Ireland Statistics and Research Agency.
- ↑ "ST104 - Ethnic group by religion - Nomis - Official Census and Labour Market Statistics". www.nomisweb.co.uk. Retrieved 9 July 2023.
- ↑ "Ethnic group by religion - Office for National Statistics". www.ons.gov.uk. Retrieved 2 April 2023.
| |||||||||||
| European emigration by location |
| ||||||||||
| Historical concepts | |||||||||||
| Sociological phenomena and theories | |||||||||||
| Negative stereotypes of Whites | |||||||||||
| White identity politics | |||||||||||