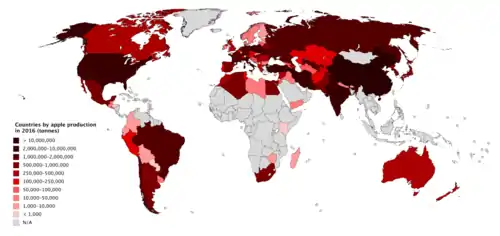
Countries by apple production in 2016
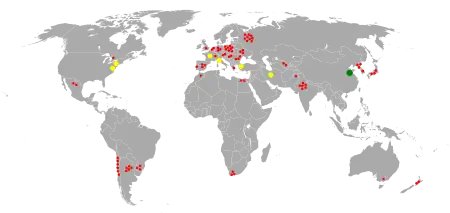
A map of apple output in 2005
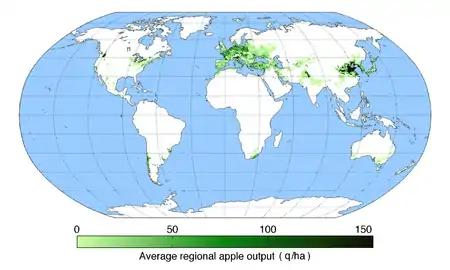
A map of world apple producing regions in 2000
This is a list of countries by apple production in 2019, 2020 and 2021 based on data from the Food and Agriculture Organization Corporate Statistical Database[1] The estimated total world production of apples in 2021 was 93,144,358 metric tonnes, up 2.9% from 90,490,295 tonnes in 2020.[1]
List of countries by production quantity
>1,000,000 tonnes
| Rank | Country/region | 2021 | 2020 | 2019 |
|---|---|---|---|---|
| – | World | 93,144,358 | 90,490,295 | 87,509,103 |
| 1 | 45,983,400 | 44,066,100 | 42,425,400 | |
| 2 | 4,493,364 | 4,300,486 | 3,618,752 | |
| 3 | 4,467,206 | 4,665,199 | 5,028,526 | |
| 4 | 4,067,400 | 3,555,200 | 3,080,600 | |
| 5 | 2,276,000 | 2,814,000 | 2,316,000 | |
| 6 | 2,241,100 | 2,241,100 | 2,241,124 | |
| 7 | 2,216,200 | 2,040,700 | 1,950,800 | |
| 8 | 2,211,740 | 2,462,440 | 2,303,690 | |
| 9 | 1,633,080 | 1,619,880 | 1,753,500 | |
| 10 | 1,556,805 | 1,607,135 | 1,592,664 | |
| 11 | 1,297,424 | 983,247 | 1,222,949 | |
| 12 | 1,278,870 | 1,114,570 | 1,153,970 | |
| 13 | 1,238,188 | 1,148,455 | 1,124,017 | |
| 14 | 1,148,771 | 998,785 | 895,399 | |
| 15 | 1,004,630 | 1,023,320 | 991,450 | |
100,000–1,000,000 tonnes
| Rank | Country/region | 2021 | 2020 | 2019 |
|---|---|---|---|---|
| 16 | 889,736 | 778,866 | 809,762 | |
| 17 | 807,170 | 814,537 | 807,955 | |
| 18 | 793,299 | 751,200 | 701,435 | |
| 19 | 733,056 | 763,300 | 701,600 | |
| 20 | 697,221 | 671,716 | 603,922 | |
| 21 | 647,700 | 480,368 | 610,921 | |
| 22 | 631,767 | 714,203 | 761,483 | |
| 23 | 615,830 | 522,100 | 638,840 | |
| 24 | 593,700 | 537,470 | 492,700 | |
| 25 | 567,301 | 559,974 | 555,873 | |
| 26 | 522,317 | 566,824 | 558,830 | |
| 27 | 515,931 | 422,115 | 535,324 | |
| 28 | 514,520 | 398,710 | 498,330 | |
| 29 | 514,000 | 587,000 | 547,846 | |
| 30 | 513,238 | 489,426 | 499,578 | |
| 31 | 463,593 | 631,597 | 610,444 | |
| 32 | 368,230 | 286,080 | 370,710 | |
| 33 | 351,565 | 390,999 | 382,771 | |
| 34 | 336,700 | 532,655 | 336,697 | |
| 35 | 308,386 | 301,410 | 292,736 | |
| 36 | 301,610 | 267,823 | 286,564 | |
| 37 | 292,587 | 270,857 | 250,324 | |
| 38 | 284,897 | 262,966 | 265,150 | |
| 39 | 281,590 | 303,580 | 277,110 | |
| 40 | 262,809 | 259,128 | 216,540 | |
| 41 | 249,740 | 168,030 | 241,860 | |
| 42 | 245,000 | 220,000 | 273,000 | |
| 43 | 239,127 | 238,284 | 236,374 | |
| 44 | 233,002 | 243,260 | 252,265 | |
| 45 | 207,044 | 236,526 | 196,223 | |
| 46 | 206,290 | 258,220 | 239,210 | |
| 47 | 155,000 | 153,000 | 116,000 | |
| 48 | 143,084 | 139,514 | 144,868 | |
| 49 | 136,652 | 136,920 | 137,734 | |
| 50 | 114,960 | 115,590 | 99,500 | |
| 51 | 111,247 | 102,167 | 107,713 | |
| 52 | 101,000 | 104,000 | 104,000 | |
50,000–100,000 tonnes
| Rank | Country/region | 2021 | 2020 | 2019 |
|---|---|---|---|---|
| 53 | 92,863 | 105,794 | 88,701 | |
| 54 | 92,653 | 84,676 | 81,674 | |
| 55 | 82,591 | 109,071 | 98,265 | |
| 56 | 78,917 | 79,413 | 75,831 | |
| 57 | 73,700 | 89,000 | 44,300 | |
| 58 | 66,784 | 66,277 | 66,349 | |
| 59 | 59,690 | 63,610 | 68,350 | |
| 60 | 56,000 | 37,039 | 42,322 | |
10,000–50,000 tonnes
| Rank | Country/region | 2021 | 2020 | 2019 |
|---|---|---|---|---|
| 61 | 47,865 | 45,205 | 31,386 | |
| 62 | 44,030 | 37,870 | 43,620 | |
| 63 | 43,922 | 44,093 | 43,345 | |
| 64 | 36,440 | 51,880 | 32,070 | |
| 65 | 32,230 | 29,360 | 22,210 | |
| 66 | 30,560 | 40,020 | 25,210 | |
| 67 | 29,590 | 28,430 | 35,190 | |
| 68 | 25,446 | 25,362 | 25,288 | |
| 69 | 23,010 | 66,120 | 54,270 | |
| 70 | 20,826 | 23,719 | 21,946 | |
| 71 | 20,537 | 19,613 | 21,051 | |
| 72 | 18,721 | 12,055 | 15,753 | |
| 73 | 16,247 | 16,264 | 16,539 | |
| 74 | 15,860 | 19,470 | 19,880 | |
| 75 | 13,081 | 12,228 | 12,441 | |
1,000–10,000 tonnes
| Rank | Country/region | 2021 | 2020 | 2019 |
|---|---|---|---|---|
| 76 | 8,200 | 13,900 | 10,390 | |
| 77 | 7,890 | 7,170 | 8,090 | |
| 78 | 7,192 | 7,164 | 7,274 | |
| 79 | 7,153 | 7,145 | 7,137 | |
| 80 | 6,640 | 6,655 | 6,670 | |
| 81 | 3,161 | 3,312 | 2,979 | |
| 82 | 2,739 | 2,750 | 2,931 | |
| 83 | 2,650 | 1,780 | 1,840 | |
| 84 | 2,324 | 4,056 | 4,321 | |
| 85 | 1,970 | 1,260 | 1,850 | |
| 86 | 1,546 | 1,402 | 1,487 | |
| 87 | 1,508 | 1,500 | 1,482 | |
| 88 | 1,458 | 1,041 | 1,178 | |
| 89 | 1,010 | 1,380 | 1,930 | |
<1,000 tonnes
| Rank | Country/region | 2021 | 2020 | 2019 |
|---|---|---|---|---|
| 90 | 939 | 940 | 936 | |
| 91 | 645 | 637 | 645 | |
| 92 | 478 | 479 | 478 | |
| 93 | 189 | 191 | 189 | |
| 94 | 118 | 106 | 261 | |
| 95 | 10 | 11 | 10 | |
List of countries by area harvested for apples
This is a list of the top ten countries by area harvested for apples in hectares (ha). The total area harvested in the world for apples was 4,822,226 hectares in 2021, up 0.8% from 4,782,734 hectares in 2020.[2]
| Rank | Country | 2021 | 2020 | 2019 |
|---|---|---|---|---|
| 1 | 2,092,326 | 2,071,385 | 2,041,197 | |
| 2 | 313,000 | 310,000 | 308,000 | |
| 3 | 225,256 | 212,939 | 209,126 | |
| 4 | 168,811 | 170,903 | 174,439 | |
| 5 | 161,900 | 152,600 | 155,620 | |
| 6 | 131,815 | 111,273 | 100,759 | |
| 7 | 117,441 | 119,707 | 119,301 | |
| 8 | 111,575 | 109,849 | 98,525 | |
| 9 | 84,400 | 85,000 | 87,700 | |
| 10 | 75,230 | 77,429 | 78,296 | |
References
External links
This article is issued from Wikipedia. The text is licensed under Creative Commons - Attribution - Sharealike. Additional terms may apply for the media files.