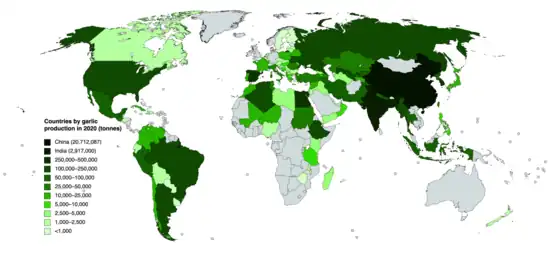
Countries by garlic production in 2020
This is a list of countries by garlic production from 2016 to 2020, based on data from the Food and Agriculture Organization Corporate Statistical Database.[1] The total world production for garlic in 2020 was 28,054,318 metric tonnes, up slightly from 28,042,647 tonnes in 2019.[n 1] China was by far the largest producer, accounting for nearly 74% of world production at 20,712,087 tonnes.
Production by country
>100,000 tons
| Rank | Country/region | 2020 | 2019 | 2018 | 2017 | 2016 |
|---|---|---|---|---|---|---|
| 1 | 20,712,087 | 20,604,480 | 20,879,169 | 20,652,612 | 20,281,659 | |
| 2 | 2,917,000 | 2,910,000 | 1,611,000 | 1,693,000 | 1,617,000 | |
| 3 | 485,447 | 466,389 | 461,970 | 425,401 | 381,851 | |
| 4 | 363,432 | 387,671 | 331,741 | 303,578 | 275,549 | |
| 5 | 333,543 | 363,460 | 348,700 | 289,766 | 272,769 | |
| 6 | 269,090 | 271,350 | 273,480 | 274,712 | 209,795 | |
| 7 | 223,719 | 216,272 | 254,857 | 214,263 | 200,869 | |
| 8 | 211,680 | 215,070 | 187,020 | 185,830 | 187,960 | |
| 9 | 211,138 | 208,908 | 203,432 | 203,681 | 212,909 | |
| 10 | 189,659 | 202,064 | 211,981 | 206,074 | 202,992 | |
| 11 | 175,674 | 194,497 | 260,340 | 232,010 | 204,780 | |
| 12 | 170,930 | 223,311 | 202,201 | 123,475 | 103,627 | |
| 13 | 155,700 | 130,900 | 118,869 | 120,896 | 132,361 | |
| 14 | 146,608 | 146,288 | 145,969 | 147,814 | 148,851 | |
| 15 | 114,945 | 152,595 | 195,740 | 178,222 | 138,664 | |
10,000–100,000 tonnes
| Rank | Country/region | 2020 | 2019 | 2018 | 2017 | 2016 |
|---|---|---|---|---|---|---|
| 16 | 90,612 | 82,991 | 104,703 | 94,887 | 78,205 | |
| 17 | 86,688 | 82,910 | 94,692 | 89,840 | 75,987 | |
| 18 | 85,642 | 75,342 | 81,167 | 75,002 | 70,925 | |
| 19 | 81,805 | 88,817 | 39,302 | 19,513 | 21,150 | |
| 20 | 76,867 | 77,120 | 76,312 | 77,170 | 77,878 | |
| 21 | 76,839 | 84,039 | 90,982 | 69,180 | 67,554 | |
| 22 | 73,859 | 71,902 | 59,500 | 56,668 | 50,426 | |
| 23 | 68,350 | 69,201 | 55,523 | 52,670 | 42,666 | |
| 24 | 58,941 | 58,654 | 58,367 | 59,355 | 59,169 | |
| 25 | 49,222 | 49,125 | 44,881 | 38,831 | 33,481 | |
| 26 | 44,947 | 47,464 | 60,075 | 43,738 | 44,497 | |
| 27 | 43,918 | 43,341 | 10,987 | 18,108 | 34,745 | |
| 28 | 29,882 | 30,215 | 30,013 | 29,417 | 31,216 | |
| 29 | 28,552 | 23,351 | 25,519 | 26,328 | 135,148 | |
| 30 | 27,970 | 29,270 | 30,500 | 29,983 | 29,568 | |
| 31 | 27,590 | 27,700 | 30,570 | 55,673 | 54,389 | |
| 32 | 26,214 | 39,118 | 44,914 | 21,541 | 21,114 | |
| 33 | 25,223 | 25,101 | 25,352 | 25,214 | 24,736 | |
| 34 | 23,693 | 21,988 | 12,780 | 14,763 | 13,532 | |
| 35 | 23,447 | 18,503 | 20,803 | 20,165 | 15,692 | |
| 36 | 22,430 | 28,140 | 20,120 | 20,464 | 21,932 | |
| 37 | 21,626 | 19,530 | 18,106 | 38,666 | 33,533 | |
| 38 | 20,893 | 20,800 | 20,200 | 20,700 | 21,100 | |
| 39 | 20,722 | 15,056 | 13,696 | 14,544 | 12,308 | |
| 40 | 14,945 | 14,956 | 14,921 | 13,199 | 9,955 | |
| 41 | 14,158 | 16,459 | 15,643 | 5,896 | 3,255 | |
| 42 | 13,500 | 15,100 | 15,830 | N/A | N/A | |
| 43 | 12,250 | 410 | 2,040 | 2,660 | 2,622 | |
| 44 | 12,094 | 14,988 | 17,320 | 19,462 | 23,257 | |
| 45 | 11,953 | 10,319 | 13,611 | 13,660 | 12,562 | |
| 46 | 11,238 | 7,449 | 4,937 | 4,260 | 3,761 | |
| 47 | 11,062 | 12,113 | 14,895 | 14,599 | 13,906 | |
| 48 | 10,429 | 9,272 | 10,175 | 6,717 | 14,207 | |
1,000–10,000 tonnes
| Rank | Country/region | 2020 | 2019 | 2018 | 2017 | 2016 |
|---|---|---|---|---|---|---|
| 49 | 8,633 | 10,081 | 10,490 | 12,610 | 14,207 | |
| 50 | 7,770 | 4,390 | 6,130 | 7,882 | 7,135 | |
| 51 | 7,382 | 7,124 | 9,510 | 11,522 | 10,166 | |
| 52 | 6,767 | 7,256 | 7,559 | 7,751 | 7,469 | |
| 53 | 6,250 | 6,235 | 6,047 | 6,468 | 6,190 | |
| 54 | 6,186 | 5,641 | 5,890 | 5,560 | 7,259 | |
| 55 | 5,210 | 7,120 | 7,930 | 7,430 | 7,899 | |
| 56 | 5,103 | 2,501 | 2,477 | 2,915 | 2,914 | |
| 57 | 4,904 | 4,515 | 4,134 | 4,214 | 4,221 | |
| 58 | 4,695 | 4,658 | 4,620 | 4,578 | 4,578 | |
| 59 | 4,182 | 3,986 | 1,810 | 1,725 | 2,760 | |
| 60 | 3,860 | 2,175 | 1,726 | 2,493 | 2,372 | |
| 61 | 3,289 | 3,296 | 3,231 | 3,292 | 3,339 | |
| 62 | 3,176 | 3,092 | 3,615 | 5,025 | 4,803 | |
| 63 | 3,112 | 3,102 | 3,131 | 3,102 | 3,072 | |
| 64 | 2,857 | 2,542 | 4,456 | 5,000 | 1,086 | |
| 65 | 2,700 | 2,100 | 4,600 | 3,500 | 2,900 | |
| 66 | 2,677 | 2,665 | 2,706 | 2,659 | 2,632 | |
| 67 | 2,540 | 2,470 | 2,390 | 0 | 0 | |
| 68 | 2,476 | 2,230 | 2,569 | 2,777 | 3,731 | |
| 69 | 2,316 | 2,506 | 3,689 | 2,589 | 2,267 | |
| 70 | 2,276 | 1,951 | 1,517 | 1,524 | 2,368 | |
| 71 | 2,219 | 1,278 | 1,800 | 2,300 | 2,300 | |
| 72 | 2,020 | 1,640 | 1,690 | 1,340 | 835 | |
| 73 | 1,970 | 2,880 | 1,730 | 1,901 | 1,444 | |
| 74 | 1,881 | 1,875 | 1,889 | 1,879 | 1,857 | |
| 75 | 1,600 | 2,220 | 1,770 | 18 | 59 | |
| 75 | 1,600 | 1,380 | 400 | 1,884 | 610 | |
| 77 | 1,320 | 1,210 | 1,120 | 1,091 | 1,025 | |
| 78 | 1,285 | 1,275 | 1,308 | 1,271 | 1,246 | |
| 79 | 1,256 | 1,248 | 1,490 | 1,563 | 1,410 | |
| 80 | 1,169 | 1,449 | 1,361 | 1,486 | 2,183 | |
| 81 | 1,090 | 1,060 | 1,020 | 1,003 | 1,089 | |
| 82 | 1,057 | 1,075 | 1,093 | 1,051 | 1,098 | |
| 83 | 1,035 | 645 | 521 | 230 | N/A | |
| 84 | 1,020 | 970 | 860 | 970 | 1,622 | |
| 85 | 1,003 | 998 | 1,012 | 1,000 | 983 | |
<1,000 tonnes
| Rank | Country/region | 2020 | 2019 | 2018 | 2017 | 2016 |
|---|---|---|---|---|---|---|
| 86 | 927 | 923 | 930 | 927 | 913 | |
| 87 | 914 | 900 | 1,178 | 1,000 | 800 | |
| 88 | 890 | 590 | 320 | 231 | 313 | |
| 89 | 691 | 761 | 550 | 708 | 1,176 | |
| 90 | 540 | 540 | 580 | 358 | 479 | |
| 91 | 487 | 623 | 432 | 280 | 351 | |
| 92 | 393 | 395 | 392 | 394 | 399 | |
| 93 | 236 | 234 | 230 | 230 | 225 | |
| 94 | 210 | 130 | 130 | 356 | 185 | |
| 95 | 207 | 206 | 207 | 206 | 205 | |
| 96 | 197 | 196 | 198 | 197 | 194 | |
| 97 | 173 | 58 | 51 | 42 | 34 | |
| 98 | 120 | 50 | 40 | N/A | N/A | |
| 99 | 110 | 70 | 10 | 75 | 141 | |
| 100 | 85 | 85 | 83 | 85 | 87 | |
| 101 | 39 | 48 | 71 | 96 | 120 | |
Notes
References
This article is issued from Wikipedia. The text is licensed under Creative Commons - Attribution - Sharealike. Additional terms may apply for the media files.