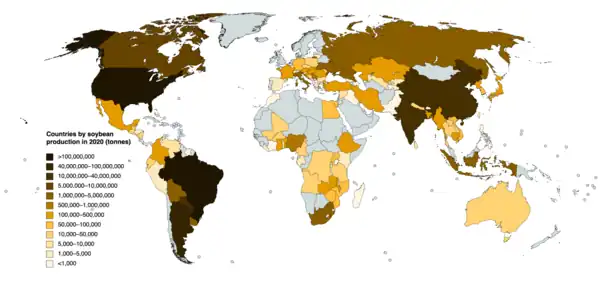
Countries by soybean production in 2020
This is a list of countries by soybean production from 2016 to 2020, based on data from the Food and Agriculture Organization Corporate Statistical Database.[1] The total world production for soybeans in 2020 was 353,463,735 metric tonnes, up 5.1% from 336,329,392 tonnes in 2019.[n 1] Brazil was the largest producer, accounting for 34% of world production, followed by the United States at 32%.
Production by country
>1,000,000 tonnes
| Rank | Country | 2020 | 2019 | 2018 | 2017 | 2016 |
|---|---|---|---|---|---|---|
| 1 | 121,797,712 | 114,316,829 | 117,912,450 | 114,732,101 | 96,394,820 | |
| 2 | 112,549,240 | 96,667,090 | 120,514,490 | 120,064,970 | 116,931,500 | |
| 3 | 48,796,661 | 55,263,891 | 37,787,927 | 54,971,626 | 58,799,258 | |
| 4 | 19,600,000 | 18,100,000 | 15,967,100 | 15,282,500 | 12,788,894 | |
| 5 | 11,226,000 | 13,267,520 | 10,932,970 | 13,158,730 | 13,159,000 | |
| 6 | 11,024,460 | 8,520,350 | 11,045,971 | 10,478,000 | 9,163,030 | |
| 7 | 6,358,500 | 6,145,000 | 7,416,600 | 7,716,600 | 6,596,500 | |
| 8 | 4,307,593 | 4,359,956 | 4,026,850 | 3,621,712 | 3,142,693 | |
| 9 | 2,829,356 | 2,990,845 | 2,942,131 | 2,671,046 | 3,203,992 | |
| 10 | 2,797,670 | 3,698,710 | 4,460,770 | 3,899,370 | 4,276,990 | |
| 11 | 1,990,000 | 2,828,000 | 1,334,000 | 3,212,000 | 2,208,000 | |
| 12 | 1,245,500 | 1,170,345 | 1,540,000 | 1,316,000 | 742,000 | |
| 13 | 1,040,000 | 980,000 | 953,571 | 538,729 | 859,653 | |
| 14 | 1,005,630 | 1,042,830 | 1,186,350 | 1,019,781 | 1,081,340 | |
100,000–1,000,000 tonnes
| Rank | Country | 2020 | 2019 | 2018 | 2017 | 2016 |
|---|---|---|---|---|---|---|
| 15 | 751,578 | 700,502 | 645,607 | 461,272 | 576,446 | |
| 16 | 600,000 | 700,000 | 660,000 | 993,955 | 936,887 | |
| 17 | 406,670 | 428,530 | 398,480 | 415,202 | 338,955 | |
| 18 | 353,640 | 440,120 | 492,680 | 393,495 | 263,380 | |
| 19 | 296,866 | 281,389 | 302,720 | 351,416 | 267,490 | |
| 20 | 266,010 | 244,280 | 245,190 | 207,765 | 244,075 | |
| 21 | 260,639 | 282,185 | 255,437 | 252,319 | 231,168 | |
| 22 | 253,954 | 257,000 | 221,977 | 164,761 | 156,901 | |
| 23 | 246,019 | 232,680 | 324,011 | 432,927 | 509,114 | |
| 24 | 229,892 | 263,920 | 135,280 | 223,325 | 282,000 | |
| 25 | 218,900 | 217,800 | 211,300 | 253,000 | 238,000 | |
| 26 | 208,676 | 125,623 | 149,455 | 86,468 | 81,235 | |
| 27 | 204,860 | 217,780 | 186,490 | 193,416 | 152,599 | |
| 28 | 180,000 | 168,000 | 170,000 | 168,000 | 162,000 | |
| 28 | 180,000 | 170,000 | 175,475 | 208,556 | 132,417 | |
| 30 | 177,007 | 184,653 | 176,700 | 170,490 | 143,220 | |
| 31 | 165,760 | 169,570 | 181,240 | 179,282 | 184,725 | |
| 32 | 155,225 | 150,000 | 140,000 | 140,000 | 165,000 | |
| 33 | 145,000 | 141,939 | 143,717 | 145,465 | 149,185 | |
| 34 | 140,000 | 150,000 | 140,000 | 130,000 | 139,325 | |
| 35 | 132,200 | 119,660 | 106,960 | 102,441 | 92,484 | |
| 36 | 119,412 | 114,056 | 92,231 | 80,106 | 80,548 | |
| 37 | 104,761 | 110,785 | 98,699 | 96,921 | 92,181 | |
10,000–100,000 tonnes
| Rank | Country | 2020 | 2019 | 2018 | 2017 | 2016 |
|---|---|---|---|---|---|---|
| 38 | 90,500 | 84,100 | 58,700 | 66,000 | 43,000 | |
| 39 | 80,926 | 105,340 | 89,410 | 85,644 | 75,448 | |
| 40 | 75,077 | 117,000 | 107,624 | 28,097 | 25,730 | |
| 41 | 75,000 | 55,000 | 55,000 | 50,000 | 47,000 | |
| 42 | 65,405 | 77,263 | 81,348 | 101,856 | 160,696 | |
| 43 | 59,656 | 23,460 | 69,688 | 36,478 | 47,755 | |
| 44 | 50,000 | 36,260 | 46,997 | 36,388 | 45,165 | |
| 45 | 48,000 | 51,708 | 31,314 | 18,500 | 25,851 | |
| 46 | 41,000 | 39,000 | 38,000 | 38,000 | 38,000 | |
| 47 | 40,797 | 37,350 | 35,266 | 36,001 | 15,740 | |
| 48 | 37,526 | 31,567 | 27,681 | 29,061 | 28,917 | |
| 49 | 37,202 | 23,753 | 23,332 | 11,740 | 18,662 | |
| 50 | 33,360 | 64,239 | 57,684 | 46,524 | 42,125 | |
| 51 | 33,020 | 27,840 | 25,260 | 37,012 | 27,972 | |
| 52 | 29,231 | 26,283 | 41,165 | 42,829 | 37,765 | |
| 53 | 27,238 | 39,515 | 25,504 | 35,006 | 41,788 | |
| 54 | 26,000 | 25,044 | 24,427 | 22,150 | 24,000 | |
| 55 | 24,195 | 23,054 | 21,270 | 26,429 | 24,558 | |
| 56 | 23,886 | 22,953 | 21,321 | 6,135 | 6,711 | |
| 57 | 23,755 | 24,526 | 22,809 | 23,934 | 21,942 | |
| 58 | 17,323 | 15,136 | 28,903 | 31,335 | 29,403 | |
| 59 | 14,940 | 15,540 | 10,390 | 20,297 | 14,747 | |
| 60 | 14,685 | 10,440 | 6,693 | 5,801 | 11,769 | |
| 61 | 14,550 | 11,873 | 8,380 | 7,960 | 19,130 | |
| 62 | 13,670 | 7,819 | 11,776 | 13,037 | 7,779 | |
| 63 | 10,000 | 10,000 | 5,693 | 5,693 | 5,693 | |
<10,000 tonnes
| Rank | Country | 2020 | 2019 | 2018 | 2017 | 2016 |
|---|---|---|---|---|---|---|
| 64 | 9,306 | 22,242 | 5,407 | 7,855 | 1,720 | |
| 65 | 7,879 | 2,197 | 2,500 | 14,363 | 9,830 | |
| 66 | 7,460 | 10,858 | 11,399 | 6,138 | 232 | |
| 67 | 6,227 | 2,086 | 1,727 | 3,901 | 3,550 | |
| 68 | 6,200 | 7,570 | 4,730 | 20,000 | 18,301 | |
| 69 | 5,247 | 5,350 | 3,740 | 5,642 | 4,500 | |
| 70 | 5,084 | 5,076 | 5,107 | 5,069 | 5,052 | |
| 71 | 5,020 | 4,240 | 5,330 | 7,713 | 7,387 | |
| 72 | 4,620 | 5,170 | 4,350 | 4,599 | 2,869 | |
| 73 | 4,447 | 4,776 | 4,404 | 4,674 | 3,061 | |
| 74 | 4,203 | 4,148 | 4,094 | 4,047 | 3,857 | |
| 75 | 3,417 | 3,392 | 3,367 | 3,346 | 3,157 | |
| 76 | 2,571 | 2,606 | 2,387 | 2,167 | 2,395 | |
| 77 | 2,560 | 2,310 | 3,450 | N/A | N/A | |
| 78 | 2,396 | 2,396 | 2,398 | 2,518 | 2,007 | |
| 79 | 2,371 | 2,835 | 2,872 | 3,512 | 1,240 | |
| 80 | 2,000 | 2,000 | 2,000 | 2,062 | 2,052 | |
| 81 | 1,840 | 3,720 | 2,520 | 8,099 | 9,465 | |
| 82 | 1,796 | 1,775 | 1,828 | 1,784 | 1,713 | |
| 83 | 1,538 | 1,475 | 1,530 | 1,581 | 1,371 | |
| 84 | 1,444 | 1,455 | 2,180 | 2,210 | 2,200 | |
| 85 | 978 | 977 | 975 | 965 | 968 | |
| 86 | 727 | 727 | 699 | 756 | 1,000 | |
| 87 | 554 | 659 | 658 | 666 | 544 | |
| 88 | 441 | 605 | 744 | 500 | 664 | |
| 89 | 401 | 401 | 371 | 581 | 700 | |
| 90 | 234 | 171 | 107 | 204 | 254 | |
| 91 | 152 | 15 | 28 | 19 | 40 | |
| 92 | 100 | 100 | 99 | 100 | 101 | |
| 93 | 46 | 46 | 46 | 47 | 46 | |
| 94 | 33 | 33 | 35 | 32 | 31 | |
| 95 | 30 | N/A | N/A | N/A | N/A | |
| 96 | 29 | 30 | 29 | 29 | 33 | |
| 97 | 21 | 21 | 21 | 21 | 21 | |
| 98 | 18 | 18 | 85 | 34 | 1 | |
| 99 | 12 | 11 | 7 | 7 | 7 | |
Production by country per capita
Here's the top 10 country with the highest production of soybean per capita.[2]
| Rank | Country | Kg per person | Region |
|---|---|---|---|
| 1 | 1,566.14 | South America | |
| 2 | 849.27 | South America | |
| 3 | 562.62 | South America | |
| 4 | 380.49 | South America | |
| 5 | 377.29 | North America | |
| 6 | 260.19 | South America | |
| 7 | 195.26 | North America | |
| 8 | 105.54 | Europe | |
| 9 | 92.21 | Europe | |
| 10 | 58.48 | Europe |
Notes
References
- ↑ "Crops". FAOSTAT. Retrieved 11 June 2022. Countries – Select All; Regions – World + (Total); Elements – Production Quantity; Items – Soybeans; Years – 2020 + 2019 + 2018 + 2017 + 2016
- ↑ World Soybean Production by Country
This article is issued from Wikipedia. The text is licensed under Creative Commons - Attribution - Sharealike. Additional terms may apply for the media files.