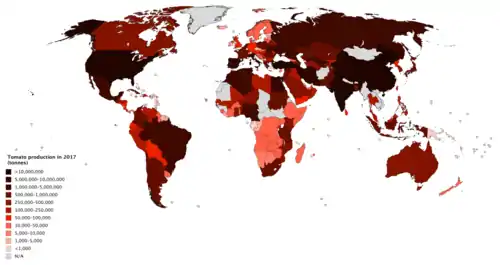
Countries by tomato production in 2017
This is a list of countries by tomato production in 2016 and 2017, based on data from the Food and Agriculture Organization Corporate Statistical Database.[1] The estimated total world production for tomatoes in 2017 was 182,301,395 metric tonnes, an increase of 1.6% from 179,508,401 tonnes in 2016.[n 1] China was by far the largest producer, accounting for nearly 33% of global production. Dependent territories are shown in italics.
Production by country
>1,000,000 tonnes
| Rank | Country | 2017 | 2016 |
|---|---|---|---|
| 1 | 59,514,773 | 57,426,955 | |
| 2 | 20,708,000 | 17,732,000 | |
| 3 | 12,750,000 | 12,600,000 | |
| 4 | 10,910,990 | 12,936,420 | |
| 5 | 7,297,108 | 7,320,714 | |
| 6 | 6,177,290 | 5,828,557 | |
| 7 | 6,015,868 | ||
| 8 | 5,163,466 | 5,233,542 | |
| 9 | 4,243,058 | 4,047,171 | |
| 10 | 4,230,150 | 4,167,629 | |
| 11 | 4,100,000 | 4,128,995 | |
| 12 | 3,230,718 | 2,986,209 | |
| 13 | 2,455,125 | 2,499,390 | |
| 14 | 2,267,460 | 2,229,690 | |
| 15 | 1,747,634 | 1,693,860 | |
| 16 | 1,298,000 | 1,333,000 | |
| 17 | 1,293,761 | 1,231,248 | |
| 18 | 1,286,286 | 1,280,570 | |
| 19 | 1,279,853 | 1,182,114 | |
100,000–1,000,000 tonnes
| Rank | Country | 2017 | 2016 |
|---|---|---|---|
| 21 | 993,076 | 910,310 | |
| 22 | 962,856 | 883,242 | |
| 23 | 910,000 | 900,000 | |
| 24 | 898,012 | 866,980 | |
| 25 | 879,000 | 1,019,880 | |
| 26 | 850,311 | 997,552 | |
| 27 | 787,141 | 837,342 | |
| 28 | 739,007 | 705,550 | |
| 29 | 737,200 | 743,200 | |
| 30 | 726,643 | 627,177 | |
| 31 | 714,314 | 690,515 | |
| 32 | 686,458 | 715,000 | |
| 33 | 660,753 | 662,834 | |
| 34 | 656,408 | 640,940 | |
| 35 | 650,001 | 617,400 | |
| 36 | 624,198 | 502,769 | |
| 37 | 608,306 | 587,772 | |
| 38 | 584,072 | 481,470 | |
| 39 | 565,441 | 528,034 | |
| 41 | 492,394 | 501,375 | |
| 42 | 450,000 | 483,740 | |
| 43 | 439,039 | 425,860 | |
| 44 | 409,398 | 361,531 | |
| 45 | 388,725 | 368,121 | |
| 46 | 380,000 | 374,000 | |
| 47 | 374,677 | 390,303 | |
| 48 | 373,289 | 385,550 | |
| 49 | 371,811 | 366,772 | |
| 50 | 371,578 | 405,167 | |
| 51 | 321,644 | 335,412 | |
| 52 | 308,865 | 314,598 | |
| 53 | 306,389 | 305,203 | |
| 54 | 291,839 | 290,570 | |
| 55 | 286,811 | 447,552 | |
| 56 | 283,000 | 410,033 | |
| 57 | 279,522 | 282,625 | |
| 58 | 263,394 | 269,079 | |
| 59 | 255,960 | 259,535 | |
| 60 | 234,228 | 298,140 | |
| 61 | 228,952 | 234,718 | |
| 62 | 220,864 | 220,344 | |
| 63 | 220,618 | 232,898 | |
| 64 | 218,793 | 210,720 | |
| 65 | 217,316 | 216,153 | |
| 66 | 211,068 | 173,095 | |
| 67 | 195,410 | 249,832 | |
| 68 | 191,597 | 89,086 | |
| 69 | 188,185 | 242,946 | |
| 70 | 176,217 | 162,140 | |
| 71 | 175,577 | 201,694 | |
| 72 | 170,764 | 160,456 | |
| 73 | 159,721 | 161,951 | |
| 74 | 158,762 | 141,367 | |
| 75 | 157,472 | 155,324 | |
| 76 | 138,000 | 102,000 | |
| 77 | 123,611 | 286,596 | |
| 78 | 113,846 | 107,582 | |
| 79 | 112,087 | 118,958 | |
| 80 | 104,046 | 81,330 | |
10,000–100,000 tonnes
| Rank | Country | 2017 | 2016 |
|---|---|---|---|
| 79 | 97,426 | 118,774 | |
| 80 | 96,561 | 85,287 | |
| 81 | 90,627 | 96,556 | |
| 82 | 88,303 | 96,768 | |
| 83 | 80,839 | 83,978 | |
| 84 | 71,577 | 74,269 | |
| 85 | 66,283 | 66,187 | |
| 86 | 62,675 | 55,550 | |
| 87 | 62,000 | 54,641 | |
| 88 | 59,090 | 61,531 | |
| 89 | 57,238 | 57,238 | |
| 90 | 55,700 | 51,095 | |
| 91 | 54,258 | 55,068 | |
| 92 | 49,900 | 54,100 | |
| 93 | 49,357 | 49,151 | |
| 94 | 46,166 | 57,070 | |
| 95 | 46,040 | 68,220 | |
| 96 | 42,533 | 41,907 | |
| 97 | 42,058 | 41,574 | |
| 98 | 41,752 | 43,791 | |
| 99 | 41,333 | 28,365 | |
| 100 | 41,223 | 30,707 | |
| 101 | 40,124 | 38,650 | |
| 102 | 40,000 | 38,000 | |
| 103 | 39,386 | 40,621 | |
| 104 | 36,000 | 36,747 | |
| 105 | 28,594 | 27,321 | |
| 106 | 28,479 | 19,092 | |
| 107 | 27,545 | 31,427 | |
| 108 | 26,619 | 25,961 | |
| 109 | 25,700 | 25,693 | |
| 110 | 21,964 | 18,922 | |
| 111 | 19,591 | 18,114 | |
| 112 | 18,511 | 18,772 | |
| 113 | 17,497 | 13,364 | |
| 114 | 16,817 | 15,133 | |
| 115 | 16,468 | 17,858 | |
| 116 | 16,340 | 16,223 | |
| 117 | 15,916 | 15,495 | |
| 118 | 14,450 | 14,620 | |
| 119 | 12,635 | 12,561 | |
| 120 | 11,974 | 11,565 | |
| 121 | 11,919 | 12,694 | |
| 122 | 10,902 | 12,380 | |
| 123 | 10,900 | 10,580 | |
| 124 | 10,651 | 10,136 | |
| 125 | 10,573 | 11,141 | |
1,000–10,000 tonnes
| Rank | Country | 2017 | 2016 |
|---|---|---|---|
| 126 | 9,551 | 9,357 | |
| 127 | 8,396 | 8,652 | |
| 128 | 5,636 | 5,484 | |
| 129 | 5,564 | 5,584 | |
| 130 | 5,500 | 6,000 | |
| 131 | 5,242 | 5,155 | |
| 132 | 5,068 | 5,821 | |
| 133 | 4,861 | 4,800 | |
| 134 | 4,819 | 14,350 | |
| 135 | 4,476 | 4,465 | |
| 136 | 4,263 | 4,493 | |
| 137 | 4,250 | 4,149 | |
| 138 | 4,245 | 4,210 | |
| 139 | 4,178 | 4,394 | |
| 140 | 3,800 | 4,000 | |
| 141 | 3,563 | 2,312 | |
| 142 | 2,875 | 4,464 | |
| 143 | 2,813 | 2,714 | |
| 144 | 2,452 | 2,858 | |
| 145 | 2,344 | 2,361 | |
| 146 | 2,103 | 2,280 | |
| 147 | 1,744 | 1,717 | |
| 148 | 1,334 | 1,436 | |
| 149 | 1,319 | 1,311 | |
| 150 | 1,239 | 1,500 | |
<1,000 tonnes
| Rank | Country | 2017 | 2016 |
|---|---|---|---|
| 151 | 885 | 861 | |
| 152 | 671 | 665 | |
| 153 | 587 | 572 | |
| 154 | 572 | 564 | |
| 155 | 526 | 512 | |
| 156 | 475 | 459 | |
| 157 | 412 | 411 | |
| 158 | 386 | 376 | |
| 159 | 383 | 445 | |
| 160 | 381 | 364 | |
| 161 | 374 | 356 | |
| 162 | 357 | 308 | |
| 163 | 320 | 305 | |
| 164 | 298 | 295 | |
| 165 | 294 | 268 | |
| 166 | 274 | 277 | |
| 167 | 243 | 237 | |
| 168 | 187 | 213 | |
| 169 | 170 | 170 | |
| 170 | 146 | 143 | |
| 171 | 134 | 134 | |
| 172 | 88 | 66 | |
| 173 | 70 | 71 | |
| 174 | 40 | 41 | |
| 175 | 5 | 5 | |
Notes
References
This article is issued from Wikipedia. The text is licensed under Creative Commons - Attribution - Sharealike. Additional terms may apply for the media files.