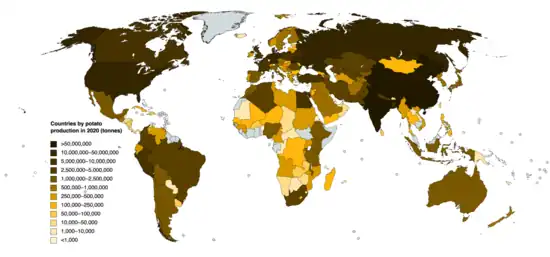
Countries by potato production in 2020
This is a list of countries by potato production from 2016 to 2020, based on data from the Food and Agriculture Organization Corporate Statistical Database.[1] The estimated total world production for potatoes in 2020 was 359,071,403 metric tonnes, up 1.2% from 354,812,093 tonnes in 2019.[n 1] China was the largest producer, accounting for 21.8% of world production, followed by India at 14.3%. Dependent territories are shown in italics.
Production by country
>1,000,000 tonnes
| Rank | Country | 2020 | 2019 | 2018 | 2017 | 2016 |
|---|---|---|---|---|---|---|
| 1 | 78,183,874 | 75,595,403 | 90,259,155 | 88,481,500 | 84,928,500 | |
| 2 | 51,300,000 | 50,190,000 | 51,310,000 | 48,605,000 | 43,417,000 | |
| 3 | 20,837,990 | 20,269,190 | 22,503,970 | 22,208,220 | 21,750,290 | |
| 4 | 19,607,361 | 22,074,874 | 22,394,960 | 21,707,645 | 22,463,487 | |
| 5 | 18,789,970 | 19,251,320 | 20,421,560 | 20,453,430 | 20,426,359 | |
| 6 | 11,715,100 | 10,602,200 | 8,920,800 | 11,720,000 | 10,772,100 | |
| 7 | 9,606,000 | 9,655,082 | 9,744,412 | 10,215,957 | 9,474,099 | |
| 8 | 8,691,900 | 8,560,410 | 7,860,380 | 8,547,354 | 6,954,983 | |
| 9 | 7,848,600 | 6,481,620 | 7,311,960 | 9,171,733 | 8,872,445 | |
| 10 | 7,020,060 | 6,961,230 | 6,025,370 | 7,391,881 | 6,534,338 | |
| 11 | 5,520,000 | 5,307,000 | 5,060,000 | 6,218,000 | 5,395,000 | |
| 12 | 5,467,041 | 5,389,231 | 5,133,927 | 4,776,294 | 4,514,239 | |
| 13 | 5,295,484 | 5,364,169 | 5,204,548 | 5,419,238 | 5,345,626 | |
| 14 | 5,231,168 | 6,105,294 | 5,864,325 | 6,414,755 | 5,984,069 | |
| 15 | 5,215,910 | 5,200,563 | 4,960,062 | 4,841,040 | 4,113,441 | |
| 16 | 5,200,000 | 4,979,824 | 4,550,000 | 4,800,000 | 4,750,000 | |
| 17 | 4,659,482 | 5,020,249 | 4,653,322 | 4,606,402 | 4,759,677 | |
| 18 | 4,552,656 | 4,869,312 | 4,591,776 | 3,852,897 | 3,977,595 | |
| 19 | 4,474,886 | 3,673,984 | 3,574,934 | 4,117,462 | 4,995,327 | |
| 20 | 4,006,780 | 3,912,103 | 3,806,992 | 3,551,114 | 3,545,695 | |
| 21 | 3,928,910 | 4,027,620 | 3,045,440 | 4,416,665 | 3,402,787 | |
| 22 | 3,767,769 | 3,711,744 | 3,728,953 | 3,655,069 | 3,851,396 | |
| 23 | 3,143,818 | 3,089,658 | 2,911,933 | 2,793,689 | 2,789,476 | |
| 24 | 3,131,830 | 3,112,947 | 3,088,000 | 2,691,037 | 2,805,582 | |
| 25 | 2,762,900 | 2,408,700 | 1,806,800 | 2,171,000 | 1,954,016 | |
| 26 | 2,698,500 | 2,626,790 | 3,022,760 | 3,116,912 | 2,689,733 | |
| 27 | 2,625,272 | 3,123,804 | 3,018,999 | 3,706,563 | 3,034,031 | |
| 28 | 2,546,996 | 2,505,775 | 2,467,724 | 2,456,990 | 2,150,811 | |
| 29 | 2,426,526 | 2,427,611 | 2,403,193 | 2,448,774 | 2,430,866 | |
| 30 | 2,274,435 | 2,399,000 | 2,260,000 | 2,395,000 | 2,199,000 | |
| 31 | 2,051,830 | 2,259,320 | 2,010,930 | 2,239,470 | 2,246,204 | |
| 32 | 1,943,910 | 1,783,896 | 1,802,592 | 1,715,499 | 1,796,814 | |
| 33 | 1,859,776 | 1,978,952 | 1,870,375 | 1,519,870 | 1,335,883 | |
| 34 | 1,707,068 | 1,956,711 | 1,869,149 | 1,924,871 | 1,743,617 | |
| 35 | 1,434,650 | 1,338,430 | 1,307,600 | 1,346,936 | 1,368,920 | |
| 36 | 1,327,163 | 1,373,800 | 1,446,610 | 1,416,011 | 1,388,369 | |
| 37 | 1,318,236 | 1,113,077 | 1,125,874 | 1,226,603 | 1,043,338 | |
| 38 | 1,317,923 | 1,256,584 | 1,160,940 | 1,045,291 | 1,073,744 | |
| 39 | 1,288,154 | 1,162,568 | 1,183,357 | 1,426,479 | 1,166,025 | |
| 40 | 1,282,768 | 1,314,654 | 1,284,760 | 1,164,743 | 1,213,041 | |
| 41 | 1,199,324 | 1,194,375 | 1,205,893 | 1,197,706 | 1,179,526 | |
| 42 | 1,141,872 | 924,528 | 933,109 | 968,970 | 921,403 | |
| 43 | 1,078,270 | 1,013,408 | 1,080,144 | 583,082 | 1,081,454 | |
| 44 | 1,076,780 | 1,225,274 | 1,188,655 | 1,105,194 | 1,130,175 | |
| 45 | 1,037,637 | 1,004,172 | 898,914 | 913,899 | 902,396 | |
100,000–1,000,000 tonnes
| Rank | Country | 2020 | 2019 | 2018 | 2017 | 2016 |
|---|---|---|---|---|---|---|
| 46 | 986,327 | 994,433 | 964,644 | 782,892 | 898,116 | |
| 47 | 885,890 | 751,260 | 697,930 | 653,400 | 767,261 | |
| 48 | 877,200 | 846,900 | 723,000 | 852,500 | 862,500 | |
| 49 | 858,521 | 973,408 | 916,062 | 846,184 | 751,284 | |
| 50 | 855,395 | 921,122 | 615,684 | 513,194 | 427,917 | |
| 51 | 696,220 | 622,600 | 583,560 | 688,970 | 699,605 | |
| 52 | 674,840 | 392,348 | 165,589 | 266,794 | 190,702 | |
| 53 | 664,891 | 702,086 | 487,909 | 589,241 | 714,350 | |
| 54 | 661,092 | 684,587 | 570,807 | 425,047 | 587,642 | |
| 55 | 647,319 | 635,519 | 562,342 | 562,416 | 478,370 | |
| 56 | 628,409 | 610,697 | 658,306 | 651,922 | 631,973 | |
| 57 | 624,400 | 618,900 | 600,300 | 611,900 | 587,600 | |
| 58 | 589,761 | 570,462 | 560,655 | 551,122 | 538,532 | |
| 59 | 561,301 | 472,127 | 425,250 | 476,418 | 466,402 | |
| 60 | 553,194 | 630,140 | 548,065 | 466,755 | 555,670 | |
| 61 | 553,115 | 520,501 | 499,374 | 474,435 | 472,345 | |
| 62 | 498,868 | 524,394 | 511,163 | 522,424 | 597,677 | |
| 63 | 493,882 | 465,927 | 439,554 | 418,622 | 415,300 | |
| 64 | 490,000 | 413,984 | 447,600 | 461,188 | 372,900 | |
| 65 | 488,155 | 465,709 | 445,679 | 421,006 | 452,673 | |
| 66 | 483,967 | 485,823 | 488,535 | 499,949 | 554,309 | |
| 67 | 450,640 | 470,210 | 465,770 | 499,506 | 491,973 | |
| 68 | 450,000 | 435,000 | 465,000 | 420,000 | 440,000 | |
| 69 | 446,111 | 455,249 | 458,217 | 461,186 | 670,456 | |
| 70 | 441,218 | 381,308 | 394,274 | 337,137 | 417,976 | |
| 71 | 437,226 | 404,057 | 415,050 | 547,420 | 606,314 | |
| 72 | 409,640 | 424,290 | 431,690 | 515,030 | 451,041 | |
| 73 | 408,313 | 275,346 | 269,201 | 377,243 | 422,589 | |
| 74 | 366,749 | 360,217 | 358,572 | 339,561 | 337,465 | |
| 75 | 361,200 | 332,200 | 326,400 | 315,500 | 350,800 | |
| 76 | 354,404 | 365,127 | 340,091 | 315,000 | 377,257 | |
| 77 | 312,583 | 297,859 | 322,539 | 294,600 | 246,500 | |
| 78 | 309,286 | 326,000 | 327,332 | 299,338 | 171,271 | |
| 79 | 303,982 | 299,074 | 307,934 | 304,937 | 284,349 | |
| 80 | 300,150 | 382,370 | 273,010 | 412,425 | 352,000 | |
| 81 | 296,740 | 329,780 | 289,800 | 237,045 | 351,484 | |
| 82 | 294,666 | 376,441 | 302,665 | 204,891 | 145,687 | |
| 83 | 294,090 | 333,729 | 376,377 | 303,675 | 302,229 | |
| 84 | 270,090 | 343,540 | 327,580 | 402,853 | 429,435 | |
| 85 | 266,866 | 162,213 | 151,326 | 131,588 | 114,424 | |
| 86 | 254,886 | 260,661 | 254,543 | 249,804 | 238,345 | |
| 87 | 247,446 | 250,000 | 257,379 | 250,160 | 244,412 | |
| 88 | 244,262 | 192,240 | 168,883 | 121,808 | 165,329 | |
| 89 | 235,635 | 198,392 | 168,569 | 165,743 | 161,181 | |
| 90 | 233,201 | 233,051 | 229,777 | 240,446 | 242,195 | |
| 91 | 225,880 | 303,257 | 310,902 | 251,558 | 210,209 | |
| 92 | 208,600 | 194,700 | 237,500 | 180,100 | 249,000 | |
| 93 | 193,426 | 190,527 | 181,931 | 178,951 | 198,529 | |
| 94 | 192,746 | 173,653 | 153,199 | 155,639 | 273,906 | |
| 95 | 192,330 | 197,410 | 261,690 | 227,815 | 127,182 | |
| 96 | 181,100 | 223,700 | 196,200 | 408,300 | 491,600 | |
| 97 | 174,280 | 173,150 | 182,260 | 156,089 | 193,962 | |
| 98 | 171,899 | 176,850 | 174,774 | 197,020 | 213,975 | |
| 99 | 166,200 | 182,420 | 169,950 | 149,705 | 177,145 | |
| 100 | 147,985 | 140,000 | 118,783 | 67,485 | 67,485 | |
| 101 | 128,803 | 128,234 | 126,935 | 131,241 | 126,525 | |
| 102 | 126,864 | 127,935 | 108,291 | 107,103 | 119,778 | |
| 103 | 115,385 | 129,500 | 135,147 | 147,044 | 95,663 | |
| 104 | 113,562 | 116,061 | 117,423 | 117,637 | 116,783 | |
| 105 | 103,818 | 102,932 | 101,694 | 100,468 | 100,136 | |
10,000–100,000 tonnes
| Rank | Country | 2020 | 2019 | 2018 | 2017 | 2016 |
|---|---|---|---|---|---|---|
| 106 | 91,972 | 94,056 | 88,557 | 84,162 | 84,127 | |
| 107 | 89,080 | 65,960 | 72,920 | 77,076 | 84,897 | |
| 108 | 88,390 | 80,130 | 58,030 | 91,182 | 89,842 | |
| 109 | 80,300 | 82,100 | 105,330 | 109,923 | 122,803 | |
| 110 | 79,980 | 38,786 | 13,546 | 31,750 | 24,428 | |
| 111 | 73,706 | 94,400 | 87,000 | 94,327 | 89,000 | |
| 112 | 68,817 | 66,858 | 66,169 | 59,699 | 39,919 | |
| 113 | 66,786 | 70,540 | 63,635 | 58,751 | 70,501 | |
| 114 | 65,085 | 101,642 | 88,897 | 73,358 | 80,458 | |
| 115 | 60,084 | 59,845 | 59,634 | 47,457 | 42,000 | |
| 116 | 52,722 | 62,447 | 62,287 | 54,929 | 58,023 | |
| 117 | 47,619 | 52,824 | 48,748 | 89,620 | 97,979 | |
| 118 | 45,500 | 43,560 | 44,278 | 57,223 | 58,820 | |
| 119 | 43,619 | 34,807 | 36,212 | 51,771 | 14,986 | |
| 120 | 39,932 | 40,072 | 41,868 | 41,298 | 37,152 | |
| 121 | 36,922 | 36,867 | 35,924 | 37,976 | 36,700 | |
| 122 | 26,781 | 26,565 | 26,643 | 26,237 | 25,500 | |
| 123 | 26,104 | 25,852 | 24,424 | 21,039 | 31,180 | |
| 124 | 23,526 | 26,560 | 26,098 | 27,500 | 29,917 | |
| 125 | 16,370 | 15,330 | 16,210 | 21,284 | 18,714 | |
| 126 | 16,146 | 15,766 | 15,613 | 15,737 | 13,116 | |
| 127 | 15,828 | 14,822 | 17,033 | 14,124 | 16,326 | |
| 128 | 15,189 | 15,297 | 15,035 | 15,235 | 15,620 | |
| 129 | 14,685 | 15,717 | 16,184 | 17,148 | 17,007 | |
| 130 | 14,328 | 14,183 | 14,513 | 14,287 | 13,748 | |
<10,000 tonnes
| Rank | Country | 2020 | 2019 | 2018 | 2017 | 2016 |
|---|---|---|---|---|---|---|
| 131 | 8,300 | 8,287 | 8,229 | 8,383 | 8,248 | |
| 132 | 7,990 | 8,990 | 9,360 | 8,740 | 6,825 | |
| 133 | 7,379 | 8,200 | 6,020 | 9,000 | 9,930 | |
| 134 | 7,025 | 6,938 | 7,016 | 7,121 | 6,677 | |
| 135 | 6,878 | 8,468 | 10,597 | 10,595 | 13,304 | |
| 136 | 5,260 | 1,800 | 12,335 | 8,765 | N/A | |
| 137 | 4,238 | 4,193 | 451 | 359 | 4,862 | |
| 138 | 3,983 | 3,867 | 3,851 | 3,760 | 3,625 | |
| 139 | 3,560 | 2,200 | 2,160 | 1,585 | 34,320 | |
| 140 | 2,616 | 2,485 | 2,510 | 1,841 | 1,379 | |
| 141 | 2,550 | 2,666 | 2,200 | 4,041 | 2,000 | |
| 142 | 2,253 | 2,249 | 2,249 | 2,353 | 2,333 | |
| 143 | 1,533 | 1,530 | 1,527 | 1,516 | 1,562 | |
| 144 | 1,331 | 1,329 | 1,335 | 1,329 | 1,322 | |
| 145 | 1,298 | 1,299 | 1,299 | 1,314 | 1,279 | |
| 146 | 1,219 | 1,223 | 1,220 | 1,214 | 1,236 | |
| 147 | 1,184 | 1,582 | 1,540 | 1,308 | 986 | |
| 148 | 716 | 719 | 711 | 719 | 726 | |
| 149 | 557 | 563 | 568 | 572 | 563 | |
| 150 | 206 | 87 | 17 | 104 | 69 | |
| 151 | 142 | 142 | 143 | 142 | 140 | |
| 152 | 63 | 96 | 60 | 98 | 103 | |
| 153 | 54 | 54 | 54 | 8 | 37 | |
| 154 | 14 | 30 | 85 | 75 | 54 | |
| – | 0 | 44 | 24 | 270 | 266 | |
Notes
References
This article is issued from Wikipedia. The text is licensed under Creative Commons - Attribution - Sharealike. Additional terms may apply for the media files.