| |||||||||||||||||||||||||||||||||||||||||||||||||||||||||||||||||||||||||||||
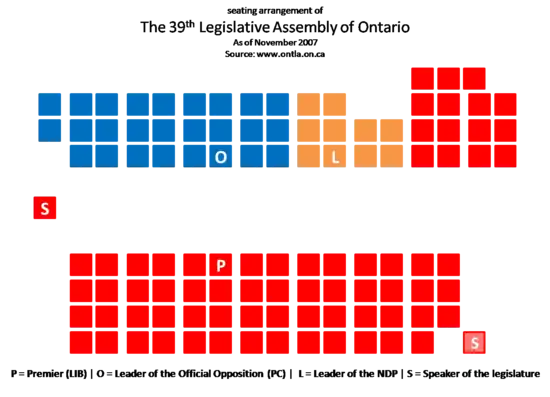
107 seats in the 39th Legislative Assembly of Ontario 54 seats were needed for a majority | |||||||||||||||||||||||||||||||||||||||||||||||||||||||||||||||||||||||||||||
|---|---|---|---|---|---|---|---|---|---|---|---|---|---|---|---|---|---|---|---|---|---|---|---|---|---|---|---|---|---|---|---|---|---|---|---|---|---|---|---|---|---|---|---|---|---|---|---|---|---|---|---|---|---|---|---|---|---|---|---|---|---|---|---|---|---|---|---|---|---|---|---|---|---|---|---|---|---|
| Turnout | 52.8% | ||||||||||||||||||||||||||||||||||||||||||||||||||||||||||||||||||||||||||||
| |||||||||||||||||||||||||||||||||||||||||||||||||||||||||||||||||||||||||||||
 Popular vote by riding. As this is an FPTP election, seat totals are not determined by popular vote, but instead via results by each riding. Riding names are listed at the bottom. | |||||||||||||||||||||||||||||||||||||||||||||||||||||||||||||||||||||||||||||
| |||||||||||||||||||||||||||||||||||||||||||||||||||||||||||||||||||||||||||||


.jpg.webp)
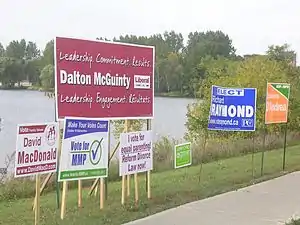
The 2007 Ontario general election was held on October 10, 2007, to elect members (MPPs) of the 39th Legislative Assembly of the Province of Ontario, Canada. The Liberals under Premier Dalton McGuinty won the election with a majority government, winning 71 out of a possible 107 seats with 42.2% of the popular vote. The election saw the third-lowest voter turnout in Ontario provincial elections, setting a then record for the lowest voter turnout with 52.8% of people who were eligible voted. This broke the previous record of 54.7% in the 1923 election,[1] but would end up being surpassed in the 2011 and 2022 elections.
As a result of legislation passed by the Legislature in 2004, election dates are now fixed by formula so that an election is held approximately four years after the previous election, unless the government is defeated by a vote of "no confidence" in the Legislature. Previously, the governing party had considerable flexibility to determine the date of an election anywhere up to five years of being elected. The date of this election was originally presumed to be October 4, 2007;[2] however, the law fixes the date on the first Thursday of October or on any day within seven days thereof if required to accommodate a date of "religious or cultural significance". The date was set as October 10, 2007, to avoid a conflict with the Jewish holiday of Shemini Atzeret, which fell on October 4, 2007.[2]
In the same election, there was a provincial referendum on whether to change from first-past-the-post to mixed member proportional representation, as recommended by the Ontario Citizens' Assembly on Electoral Reform. This measure failed, with 37% of the participating electorate and 5 out of 107 ridings voting for the new system; a 60% supermajority was required province-wide, with at least 2/3 of the ridings also supporting it by a simple majority.[3]
Issues
Although all four parties released a variety of detailed platform proposals, the campaign was dominated almost entirely by John Tory's promise to extend public funding to Ontario's faith-based schools.[4]
In Ontario at present, the Catholic school system is fully funded in the same manner as public schools. However, other religious schools, such as Jewish, Muslim or Evangelical Christian schools, are not funded by the province. This discrepancy has been cited as discriminatory by both the Supreme Court of Canada and the United Nations Human Rights Committee, although to date the province has taken no action to change its existing school funding policies, on the grounds that Catholic school funding in the province is mandated by the Constitution of Canada.
Tory's proposal to extend funding to religious schools was controversial, with polls confirming that a clear majority of Ontarians opposed the proposal. Even some of Tory's own caucus, most notably Bill Murdoch and Garfield Dunlop, openly criticized the proposal during the election campaign. After heavy opposition, Tory changed his position later in the campaign, promising a free vote on the issue.[5]
The Liberals and the NDP were both opposed to non-Catholic religious school funding, while the Green Party proposed eliminating the province's existing Catholic school funding in favour of a single public school board. Liberal opposition to non-Catholic religious school funding, especially private Muslim schools, appealed to Islamophobic sentiment in the province.[6][7]
There was a brief flurry of interest in health care issues when John Tory emphasized his support for an increasing role for the private sector in health care.
In the final week of the campaign, NDP leader Howard Hampton criticized the media for focusing almost entirely on religious schools and virtually ignoring other issues.
Redistribution
With the passing of Bill 214 and the Representation Act, 2005 in the year 2005, Ontario's electoral boundaries were no longer identical to the federal electoral boundaries.[8] The province was now divided into 11 northern electoral districts that were identical, except for a minor boundary adjustment, to the ones that existed on October 2, 2003, and 96 southern electoral districts that were identical to their federal counterparts as they existed on September 1, 2004.[8]
The 11 northern electoral districts were: Algoma—Manitoulin, Kenora—Rainy River, Nickel Belt, Nipissing, Parry Sound—Muskoka, Sault Ste. Marie, Sudbury, Thunder Bay—Atikokan, Thunder Bay—Superior North, Timiskaming—Cochrane, and Timmins—James Bay.[8]
As a result of the redistribution, none of the three major parties took fewer seats than it held at the dissolution of the previous legislature. The Liberals and the Progressive Conservatives each gained seats, while the New Democratic Party's seat total remained unchanged.
Results
| Party | Party leader | Candidates | Seats | Popular vote | ||||||
|---|---|---|---|---|---|---|---|---|---|---|
| 2003 | Dissol. | 2007 | Change | # | % | Change | ||||
| Liberal | Dalton McGuinty | 107 | 72 | 67 | 71 | +6.0% | 1,869,273 | 42.25% | -4.22% | |
| Progressive Conservative | John Tory | 107 | 24 | 25 | 26 | +4.0% | 1,398,806 | 31.62% | -3.05% | |
| New Democratic | Howard Hampton | 107 | 7 | 10 | 10 | - | 741,465 | 16.77% | +2.08% | |
| Green | Frank de Jong | 107 | - | - | - | - | 354,897 | 8.02% | +5.20% | |
| Family Coalition | Giuseppe Gori | 83 | - | - | - | - | 35,702 | 0.81% | +0.01% | |
| Libertarian | Sam Apelbaum | 25 | - | - | - | - | 9,249 | 0.21% | +0.17% | |
| Freedom | Paul McKeever | 15 | - | - | - | - | 3,003 | 0.07% | -0.13% | |
| Communist | Elizabeth Rowley | 8 | - | - | - | - | 1,603 | 0.04% | -0.01% | |
| Special Needs | Danish Ahmed | 2 | - | - | - | - | 502 | 0.01% | - | |
| Confederation of Regions | Eileen Butson | 2 | - | - | - | - | 446 | 0.01% | +0.00% | |
| Reform | Brad Harness | 2 | - | - | - | - | 354 | 0.01% | - | |
| Republican | Trueman Tuck | 2 | - | - | - | - | 272 | 0.01% | - | |
| Independents and no affiliation | 32 | - | - | - | - | 8,326 | 0.19% | -0.11% | ||
| Vacant | 1 | |||||||||
| Total | 103 | 103 | 107 | 8,380,551 | 4,423,898 | 100% | - | |||
- Two independent candidates are running for the unregistered Communist League, while two others are perennial candidates of the Communist Party of Canada (Marxist–Leninist).
- Eileen Butson, party president, acted as the CoR's spokesperson as the party decided not to have a party leader.
Synopsis of results
| Riding | Winning party | Turnout [a 2] |
Votes[a 3] | |||||||||||||
|---|---|---|---|---|---|---|---|---|---|---|---|---|---|---|---|---|
| Party | Votes | Share | Margin # |
Margin % |
Lib | PC | NDP | Green | Ind | Other | Total | |||||
| Ajax—Pickering | Lib | 19,857 | 49.07% | 5,959 | 14.73% | 49.34% | 19,857 | 13,898 | 3,275 | 3,067 | - | 368 | 40,465 | |||
| Algoma—Manitoulin | Lib | 11,361 | 42.56% | 1,498 | 5.61% | 54.49% | 11,361 | 3,744 | 9,863 | 1,374 | - | 354 | 26,696 | |||
| Ancaster—Dundas—Flamborough—Westdale | Lib | 20,445 | 41.16% | 3,353 | 6.75% | 58.12% | 20,445 | 17,092 | 6,814 | 4,112 | 222 | 985 | 49,670 | |||
| Barrie | Lib | 19,548 | 42.20% | 1,381 | 2.98% | 51.95% | 19,548 | 18,167 | 3,700 | 4,385 | 179 | 341 | 46,320 | |||
| Beaches—East York | NDP | 17,522 | 44.32% | 7,307 | 18.48% | 54.37% | 10,215 | 6,166 | 17,522 | 4,785 | - | 851 | 39,539 | |||
| Bramalea—Gore—Malton | Lib | 19,106 | 47.00% | 7,172 | 17.64% | 43.65% | 19,106 | 11,934 | 5,016 | 4,120 | - | 471 | 40,647 | |||
| Brampton—Springdale | Lib | 17,673 | 50.66% | 6,965 | 19.97% | 43.45% | 17,673 | 10,708 | 3,800 | 2,292 | - | 410 | 34,883 | |||
| Brampton West | Lib | 20,746 | 46.19% | 5,626 | 12.53% | 43.92% | 20,746 | 15,120 | 4,901 | 3,471 | 185 | 488 | 44,911 | |||
| Brant | Lib | 23,485 | 49.16% | 9,698 | 20.30% | 52.69% | 23,485 | 13,787 | 6,536 | 3,272 | 289 | 403 | 47,772 | |||
| Bruce—Grey—Owen Sound | PC | 21,156 | 46.61% | 6,117 | 13.48% | 59.96% | 6,774 | 21,156 | 1,721 | 15,039 | - | 695 | 45,385 | |||
| Burlington | PC | 21,578 | 41.34% | 1,854 | 3.55% | 58.91% | 19,724 | 21,578 | 5,728 | 4,779 | - | 391 | 52,200 | |||
| Cambridge | PC | 17,942 | 41.70% | 3,238 | 7.52% | 49.69% | 14,704 | 17,942 | 5,896 | 3,842 | - | 646 | 43,030 | |||
| Carleton—Mississippi Mills | PC | 25,126 | 47.83% | 8,350 | 15.89% | 55.30% | 16,776 | 25,126 | 4,002 | 5,517 | - | 1,112 | 52,533 | |||
| Chatham-Kent—Essex | Lib | 18,782 | 51.98% | 8,415 | 23.29% | 48.81% | 18,782 | 10,367 | 4,601 | 2,054 | - | 326 | 36,130 | |||
| Davenport | Lib | 12,467 | 41.82% | 1,587 | 5.32% | 45.84% | 12,467 | 2,805 | 10,880 | 3,047 | 114 | 500 | 29,813 | |||
| Don Valley East | Lib | 19,667 | 55.63% | 10,789 | 30.52% | 51.30% | 19,667 | 8,878 | 3,759 | 2,287 | 467 | 297 | 35,355 | |||
| Don Valley West | Lib | 23,080 | 50.44% | 4,924 | 10.76% | 59.20% | 23,080 | 18,156 | 2,138 | 2,202 | - | 183 | 45,759 | |||
| Dufferin—Caledon | PC | 16,522 | 41.85% | 3,884 | 9.84% | 52.50% | 12,638 | 16,522 | 3,893 | 6,430 | - | - | 39,483 | |||
| Durham | PC | 21,515 | 46.96% | 6,785 | 14.81% | 54.34% | 14,730 | 21,515 | 5,521 | 4,053 | - | - | 45,819 | |||
| Eglinton—Lawrence | Lib | 17,402 | 43.23% | 2,145 | 5.33% | 55.62% | 17,402 | 15,257 | 4,039 | 2,871 | 90 | 594 | 40,253 | |||
| Elgin—Middlesex—London | Lib | 20,085 | 49.10% | 7,625 | 18.64% | 53.09% | 20,085 | 12,460 | 4,643 | 3,363 | - | 353 | 40,904 | |||
| Essex | Lib | 19,970 | 48.02% | 9,570 | 23.01% | 48.69% | 19,970 | 10,400 | 8,638 | 2,220 | - | 358 | 41,586 | |||
| Etobicoke Centre | Lib | 22,939 | 50.07% | 7,272 | 15.87% | 59.40% | 22,939 | 15,667 | 3,847 | 3,357 | - | - | 45,810 | |||
| Etobicoke—Lakeshore | Lib | 20,218 | 45.99% | 6,736 | 15.32% | 53.62% | 20,218 | 13,482 | 5,837 | 3,467 | 480 | 478 | 43,962 | |||
| Etobicoke North | Lib | 15,147 | 54.85% | 9,346 | 33.84% | 45.19% | 15,147 | 5,801 | 4,101 | 1,312 | - | 1,255 | 27,616 | |||
| Glengarry—Prescott—Russell | Lib | 24,345 | 60.51% | 13,418 | 33.35% | 52.80% | 24,345 | 10,927 | 2,281 | 2,344 | - | 337 | 40,234 | |||
| Guelph | Lib | 20,346 | 40.92% | 8,166 | 16.42% | 57.03% | 20,346 | 12,180 | 6,880 | 9,750 | - | 571 | 49,727 | |||
| Haldimand—Norfolk | PC | 26,135 | 60.92% | 16,599 | 38.69% | 56.25% | 9,536 | 26,135 | 4,546 | 2,230 | - | 457 | 42,904 | |||
| Haliburton—Kawartha Lakes—Brock | PC | 24,273 | 49.99% | 9,946 | 20.49% | 59.22% | 14,327 | 24,273 | 5,785 | 3,475 | - | 692 | 48,552 | |||
| Halton | PC | 22,677 | 41.84% | 176 | 0.32% | 51.53% | 22,501 | 22,677 | 4,160 | 4,376 | - | 487 | 54,201 | |||
| Hamilton Centre | NDP | 17,176 | 44.72% | 6,080 | 15.83% | 48.63% | 11,096 | 5,673 | 17,176 | 3,610 | - | 852 | 38,407 | |||
| Hamilton East—Stoney Creek | NDP | 16,272 | 37.65% | 1,210 | 2.80% | 51.36% | 15,062 | 9,310 | 16,272 | 2,122 | - | 452 | 43,218 | |||
| Hamilton Mountain | Lib | 17,387 | 37.24% | 1,734 | 3.71% | 53.33% | 17,387 | 10,982 | 15,653 | 2,172 | - | 493 | 46,687 | |||
| Huron—Bruce | Lib | 20,469 | 45.95% | 6,863 | 15.41% | 59.80% | 20,469 | 13,606 | 5,932 | 2,911 | 595 | 1,035 | 44,548 | |||
| Kenora—Rainy River | NDP | 14,281 | 60.62% | 8,529 | 36.20% | 46.16% | 5,752 | 2,757 | 14,281 | 769 | - | - | 23,559 | |||
| Kingston and the Islands | Lib | 23,277 | 47.23% | 12,276 | 24.91% | 53.96% | 23,277 | 11,001 | 10,129 | 4,321 | - | 556 | 49,284 | |||
| Kitchener Centre | Lib | 17,484 | 45.90% | 7,767 | 20.39% | 49.58% | 17,484 | 9,717 | 6,707 | 3,162 | 425 | 599 | 38,094 | |||
| Kitchener—Conestoga | Lib | 16,315 | 41.82% | 1,865 | 4.78% | 49.25% | 16,315 | 14,450 | 4,545 | 2,805 | - | 901 | 39,016 | |||
| Kitchener—Waterloo | PC | 20,748 | 40.84% | 4,900 | 9.65% | 53.63% | 15,848 | 20,748 | 8,902 | 4,707 | - | 598 | 50,803 | |||
| Lambton—Kent—Middlesex | Lib | 18,228 | 43.27% | 2,933 | 6.96% | 55.18% | 18,228 | 15,295 | 4,520 | 3,329 | - | 758 | 42,130 | |||
| Lanark—Frontenac—Lennox and Addington | PC | 18,213 | 40.58% | 820 | 1.83% | 52.08% | 17,393 | 18,213 | 5,623 | 3,186 | - | 462 | 44,877 | |||
| Leeds—Grenville | PC | 22,755 | 56.24% | 11,153 | 27.56% | 55.11% | 11,602 | 22,755 | 2,821 | 2,907 | - | 377 | 40,462 | |||
| London—Fanshawe | Lib | 13,742 | 38.68% | 3,982 | 11.21% | 48.21% | 13,742 | 9,760 | 9,350 | 2,548 | 129 | - | 35,529 | |||
| London North Centre | Lib | 21,669 | 47.17% | 10,772 | 23.45% | 50.00% | 21,669 | 10,897 | 7,649 | 5,720 | - | - | 45,935 | |||
| London West | Lib | 25,967 | 52.42% | 13,956 | 28.18% | 57.83% | 25,967 | 12,011 | 5,562 | 5,184 | 201 | 607 | 49,532 | |||
| Markham—Unionville | Lib | 21,149 | 59.47% | 11,575 | 32.55% | 40.51% | 21,149 | 9,574 | 2,597 | 1,910 | - | 335 | 35,565 | |||
| Mississauga—Brampton South | Lib | 19,738 | 53.78% | 10,405 | 28.35% | 42.46% | 19,738 | 9,333 | 3,785 | 3,846 | - | 0 | 36,702 | |||
| Mississauga East—Cooksville | Lib | 22,249 | 58.93% | 13,534 | 35.85% | 47.48% | 22,249 | 8,715 | 3,192 | 2,361 | - | 1,235 | 37,752 | |||
| Mississauga—Erindale | Lib | 21,551 | 47.85% | 6,638 | 14.74% | 47.08% | 21,551 | 14,913 | 5,056 | 3,521 | - | - | 45,041 | |||
| Mississauga South | Lib | 19,195 | 46.68% | 5,008 | 12.18% | 54.08% | 19,195 | 14,187 | 3,745 | 3,629 | - | 365 | 41,121 | |||
| Mississauga—Streetsville | Lib | 20,264 | 52.55% | 9,109 | 23.62% | 45.63% | 20,264 | 11,155 | 3,944 | 2,925 | - | 274 | 38,562 | |||
| Nepean—Carleton | PC | 27,070 | 50.28% | 9,339 | 17.35% | 54.61% | 17,731 | 27,070 | 4,000 | 4,500 | - | 533 | 53,834 | |||
| Newmarket—Aurora | PC | 19,460 | 42.72% | 1,355 | 2.97% | 55.21% | 18,105 | 19,460 | 3,290 | 4,182 | - | 518 | 45,555 | |||
| Niagara Falls | Lib | 22,210 | 47.53% | 7,670 | 16.41% | 51.08% | 22,210 | 14,540 | 4,605 | 5,373 | - | - | 46,728 | |||
| Niagara West—Glanbrook | PC | 24,311 | 51.06% | 10,021 | 21.05% | 58.57% | 14,290 | 24,311 | 5,809 | 3,206 | - | - | 47,616 | |||
| Nickel Belt | NDP | 15,126 | 46.59% | 2,762 | 8.51% | 53.56% | 12,364 | 3,263 | 15,126 | 1,374 | - | 341 | 32,468 | |||
| Nipissing | Lib | 13,781 | 42.11% | 458 | 1.40% | 56.79% | 13,781 | 13,323 | 4,136 | 1,248 | - | 238 | 32,726 | |||
| Northumberland—Quinte West | Lib | 22,287 | 45.37% | 6,957 | 14.16% | 54.92% | 22,287 | 15,330 | 6,492 | 5,012 | - | - | 49,121 | |||
| Oak Ridges—Markham | Lib | 28,564 | 48.22% | 7,197 | 12.15% | 47.77% | 28,564 | 21,367 | 4,698 | 3,815 | 342 | 455 | 59,241 | |||
| Oakville | Lib | 23,761 | 49.81% | 7,102 | 14.89% | 58.26% | 23,761 | 16,659 | 3,091 | 3,916 | - | 279 | 47,706 | |||
| Oshawa | PC | 15,977 | 39.02% | 2,495 | 6.09% | 48.94% | 8,762 | 15,977 | 13,482 | 2,474 | - | 253 | 40,948 | |||
| Ottawa Centre | Lib | 18,255 | 34.91% | 2,094 | 4.00% | 58.25% | 18,255 | 10,416 | 16,161 | 6,458 | 283 | 720 | 52,293 | |||
| Ottawa—Orléans | Lib | 25,649 | 52.86% | 8,954 | 18.45% | 57.86% | 25,649 | 16,695 | 3,088 | 2,214 | - | 875 | 48,521 | |||
| Ottawa South | Lib | 24,015 | 50.13% | 9,809 | 20.48% | 56.60% | 24,015 | 14,206 | 4,467 | 3,902 | - | 1,311 | 47,901 | |||
| Ottawa—Vanier | Lib | 20,954 | 50.96% | 11,785 | 28.66% | 51.49% | 20,954 | 9,169 | 6,049 | 4,293 | 255 | 396 | 41,116 | |||
| Ottawa West—Nepean | Lib | 23,842 | 50.64% | 8,871 | 18.84% | 57.51% | 23,842 | 14,971 | 4,564 | 2,903 | 207 | 592 | 47,079 | |||
| Oxford | PC | 18,445 | 47.27% | 6,990 | 17.91% | 53.72% | 11,455 | 18,445 | 4,421 | 3,441 | 659 | 601 | 39,022 | |||
| Parkdale—High Park | NDP | 18,194 | 44.71% | 6,294 | 15.47% | 57.43% | 11,900 | 6,024 | 18,194 | 3,938 | - | 638 | 40,694 | |||
| Parry Sound—Muskoka | PC | 17,348 | 47.22% | 7,529 | 20.49% | 56.76% | 9,819 | 17,348 | 5,015 | 4,557 | - | - | 36,739 | |||
| Perth—Wellington | Lib | 18,096 | 46.65% | 5,758 | 14.84% | 54.62% | 18,096 | 12,338 | 3,912 | 3,051 | 217 | 1,175 | 38,789 | |||
| Peterborough | Lib | 24,466 | 47.72% | 11,290 | 22.02% | 57.47% | 24,466 | 13,176 | 8,523 | 4,473 | - | 634 | 51,272 | |||
| Pickering—Scarborough East | Lib | 19,762 | 48.63% | 6,878 | 16.92% | 54.01% | 19,762 | 12,884 | 4,563 | 2,572 | 275 | 585 | 40,641 | |||
| Prince Edward—Hastings | Lib | 20,963 | 46.36% | 6,123 | 13.54% | 54.16% | 20,963 | 14,840 | 6,287 | 2,663 | - | 463 | 45,216 | |||
| Renfrew—Nipissing—Pembroke | PC | 24,975 | 62.34% | 15,070 | 37.62% | 57.55% | 9,905 | 24,975 | 3,038 | 1,777 | - | 368 | 40,063 | |||
| Richmond Hill | Lib | 19,456 | 47.83% | 5,329 | 13.10% | 47.23% | 19,456 | 14,127 | 3,565 | 3,210 | - | 318 | 40,676 | |||
| St. Catharines | Lib | 21,029 | 47.23% | 8,165 | 18.34% | 53.83% | 21,029 | 12,864 | 7,069 | 3,152 | - | 406 | 44,520 | |||
| St. Paul's | Lib | 21,280 | 47.43% | 9,370 | 20.88% | 55.99% | 21,280 | 11,910 | 7,061 | 3,744 | 328 | 545 | 44,868 | |||
| Sarnia—Lambton | PC | 16,145 | 38.16% | 3,702 | 8.75% | 55.20% | 12,443 | 16,145 | 11,349 | 2,376 | - | - | 42,313 | |||
| Sault Ste. Marie | Lib | 19,316 | 60.13% | 10,841 | 33.75% | 55.56% | 19,316 | 2,349 | 8,475 | 1,377 | - | 605 | 32,122 | |||
| Scarborough—Agincourt | Lib | 19,541 | 58.08% | 11,010 | 32.72% | 46.01% | 19,541 | 8,531 | 3,531 | 1,511 | - | 532 | 33,646 | |||
| Scarborough Centre | Lib | 17,775 | 53.66% | 9,455 | 28.55% | 48.06% | 17,775 | 8,320 | 4,401 | 1,827 | - | 800 | 33,123 | |||
| Scarborough—Guildwood | Lib | 14,430 | 42.52% | 4,927 | 14.52% | 51.28% | 14,430 | 9,503 | 7,441 | 1,811 | - | 751 | 33,936 | |||
| Scarborough—Rouge River | Lib | 22,307 | 65.06% | 17,347 | 50.59% | 41.82% | 22,307 | 4,960 | 4,691 | 1,276 | - | 1,055 | 34,289 | |||
| Scarborough Southwest | Lib | 15,114 | 46.15% | 6,755 | 20.63% | 49.70% | 15,114 | 8,359 | 5,930 | 2,649 | - | 695 | 32,747 | |||
| Simcoe—Grey | PC | 24,270 | 50.65% | 11,823 | 24.67% | 54.86% | 12,447 | 24,270 | 4,417 | 5,428 | 273 | 1,085 | 47,920 | |||
| Simcoe North | PC | 22,986 | 49.82% | 8,892 | 19.27% | 54.06% | 14,094 | 22,986 | 4,240 | 4,709 | - | 112 | 46,141 | |||
| Stormont—Dundas—South Glengarry | Lib | 18,660 | 48.86% | 3,866 | 10.12% | 51.81% | 18,660 | 14,794 | 2,813 | 1,680 | - | 247 | 38,194 | |||
| Sudbury | Lib | 19,307 | 58.77% | 10,393 | 31.64% | 51.11% | 19,307 | 2,605 | 8,914 | 1,608 | 124 | 293 | 32,851 | |||
| Thornhill | PC | 22,244 | 45.92% | 1,725 | 3.56% | 52.17% | 20,519 | 22,244 | 2,657 | 2,507 | 158 | 356 | 48,441 | |||
| Thunder Bay—Atikokan | Lib | 10,928 | 37.69% | 50 | 0.17% | 52.36% | 10,928 | 5,918 | 10,878 | 1,270 | - | - | 28,994 | |||
| Thunder Bay—Superior North | Lib | 13,373 | 46.78% | 2,435 | 8.52% | 53.91% | 13,373 | 2,688 | 10,938 | 1,586 | - | - | 28,585 | |||
| Timiskaming—Cochrane | Lib | 11,588 | 42.90% | 634 | 2.35% | 54.80% | 11,588 | 3,659 | 10,954 | 811 | - | - | 27,012 | |||
| Timmins—James Bay | NDP | 13,176 | 51.60% | 3,447 | 13.50% | 53.76% | 9,729 | 2,191 | 13,176 | 437 | - | - | 25,533 | |||
| Toronto Centre | Lib | 21,522 | 47.85% | 12,438 | 27.65% | 49.90% | 21,522 | 9,084 | 8,464 | 4,412 | 358 | 1,141 | 44,981 | |||
| Toronto—Danforth | NDP | 17,975 | 45.85% | 6,527 | 16.65% | 53.18% | 11,448 | 4,423 | 17,975 | 4,372 | - | 986 | 39,204 | |||
| Trinity—Spadina | NDP | 18,508 | 41.15% | 4,328 | 9.62% | 49.63% | 14,180 | 6,235 | 18,508 | 5,156 | 504 | 390 | 44,973 | |||
| Vaughan | Lib | 28,964 | 61.90% | 20,205 | 43.18% | 46.31% | 28,964 | 8,759 | 5,470 | 2,975 | 623 | - | 46,791 | |||
| Welland | NDP | 24,910 | 53.94% | 14,330 | 31.03% | 55.29% | 10,580 | 8,722 | 24,910 | 1,973 | - | - | 46,185 | |||
| Wellington—Halton Hills | PC | 21,533 | 49.16% | 8,221 | 18.77% | 57.49% | 13,312 | 21,533 | 3,914 | 4,489 | - | 555 | 43,803 | |||
| Whitby—Oshawa | PC | 22,694 | 44.00% | 4,134 | 8.02% | 53.54% | 18,560 | 22,694 | 5,734 | 3,745 | - | 839 | 51,572 | |||
| Willowdale | Lib | 21,166 | 47.73% | 5,608 | 12.65% | 49.51% | 21,166 | 15,558 | 3,699 | 2,960 | 119 | 847 | 44,349 | |||
| Windsor—Tecumseh | Lib | 17,894 | 49.34% | 9,058 | 24.98% | 44.04% | 17,894 | 6,106 | 8,836 | 2,696 | - | 735 | 36,267 | |||
| Windsor West | Lib | 16,821 | 50.19% | 8,217 | 24.52% | 41.02% | 16,821 | 5,652 | 8,604 | 1,974 | - | 463 | 33,514 | |||
| York Centre | Lib | 16,646 | 48.73% | 5,618 | 16.45% | 49.07% | 16,646 | 11,028 | 3,713 | 2,207 | - | 568 | 34,162 | |||
| York—Simcoe | PC | 19,173 | 46.23% | 6,388 | 15.40% | 49.73% | 12,785 | 19,173 | 4,205 | 4,664 | - | 645 | 41,472 | |||
| York South—Weston | Lib | 13,846 | 42.94% | 452 | 1.40% | 46.34% | 13,846 | 3,173 | 13,394 | 1,226 | - | 603 | 32,242 | |||
| York West | Lib | 13,246 | 54.74% | 6,482 | 26.79% | 44.44% | 13,246 | 2,484 | 6,764 | 1,199 | 225 | 282 | 24,200 | |||
- = new riding
- = merged riding
- = open seat
- = turnout is above provincial average
- = incumbent re-elected
- = incumbent changed allegiance
- = other incumbents renominated
- ↑ "2007 Ontario General Election". elections.on.ca. Elections Ontario. Retrieved June 21, 2023.
- ↑ including spoilt ballots
- ↑ minor political parties receiving less than 1% of the popular vote are aggregated under "Other"; independent candidates are aggregated separately
Maps
 Support for Liberal Party candidates by riding
 Support for Progressive Conservative Party candidates by riding
 Support for New Democratic Party candidates by riding
 Support for Green Party candidates by riding
Principal races
| Party in 1st place | Party in 2nd place | Total | ||||
|---|---|---|---|---|---|---|
| Lib | PC | NDP | Grn | |||
| Liberal | – | 58 | 13 | 71 | ||
| Progressive Conservative | 24 | – | 1 | 1 | 26 | |
| New Democratic | 10 | – | 10 | |||
| Total | 34 | 58 | 14 | 1 | 107 | |
| Parties | Seats | |
|---|---|---|
| █ Liberal | █ Progressive Conservative | 82 |
| █ Liberal | █ New Democratic | 23 |
| █ Progressive Conservative | █ New Democratic | 1 |
| █ Progressive Conservative | █ Green | 1 |
| Total | 107 | |
| Parties | 1st | 2nd | 3rd | 4th | 5th | Total |
|---|---|---|---|---|---|---|
| █ Liberal | 71 | 34 | 2 | 107 | ||
| █ Progressive Conservative | 26 | 58 | 22 | 1 | 107 | |
| █ New Democratic | 10 | 14 | 65 | 18 | 107 | |
| █ Green | 1 | 18 | 88 | 107 | ||
| █ Family Coalition | 63 | 63 | ||||
| █ Libertarian | 16 | 16 | ||||
| █ Independent | 8 | 8 | ||||
| █ Freedom | 2 | 2 | ||||
| █ Communist | 1 |
| Source | Party | |||||
|---|---|---|---|---|---|---|
| Lib | PC | NDP | Total | |||
| Incumbents returned | 60 | 22 | 8 | 90 | ||
| Open seats held | 3 | 1 | 1 | 5 | ||
| Ouster of incumbent changing allegiance | 1 | 1 | ||||
| New seats gained | 5 | 1 | 6 | |||
| Incumbents defeated | 2 | 2 | 4 | |||
| Open seats gained | 1 | 1 | ||||
| Total | 71 | 26 | 10 | 107 | ||
Incumbent MPPs who did not run for re-election
| Electoral district | Incumbent at dissolution | Subsequent nominee | New MPP | ||
|---|---|---|---|---|---|
| Hamilton Mountain | Marie Bountrogianni | Sophia Aggelonitis | Sophia Aggelonitis | ||
| Scarborough East | Mary Anne Chambers | riding dissolved | |||
| Hamilton West | Judy Marsales | riding dissolved | |||
| Nickel Belt | Shelley Martel | France Gélinas | France Gélinas | ||
| Stoney Creek | Jennifer Mossop | Riding dissolved | |||
| Prince Edward—Hastings | Ernie Parsons | Leona Dombrowsky | Leona Dombrowsky | ||
| Ottawa Centre | Richard Patten | Yasir Naqvi | Yasir Naqvi | ||
Opinion polls
Since the 2003 general election, several polls were conducted to determine the ongoing preference of voters. They showed a decline in Liberal support following the 2004 Ontario budget. Overall, support for the governing Liberals declined slightly since the 2003 election, the NDP gained some ground since the 2003 election, and the PCs' poll numbers did not change significantly since 2003. Support for the Green Party increased significantly, a shift which paralleled the increase in support for the party's federal counterpart. During the pre-election period, the Ontario Greens did not appear as an option in some of the polls.
Polls indicate results for decided voters. More information can be found in the footnotes to each poll, including undecided results, if provided by the pollster. A dash indicates the absence of a prompt for that party.
| Polling firm | Date released | Date poll conducted | Liberal | Progressive Conservative | New Democrats | Green |
|---|---|---|---|---|---|---|
| Harris-Decima | October 9, 2007[9] | October 6 – 7, 2007 | 42 | 31 | 17 | 10 |
| SES Research | October 9, 2007[10] | October 6 – 7, 2007 | 43 | 31 | 18 | 9 |
| Environics | October 9, 2007[11] | September 28 – October 2, 2007 | 46 | 31 | 20 | 3 |
| Strategic Counsel | October 8, 2007[12] | October 6 – 7, 2007 | 42 | 27 | 19 | 11 |
| Ipsos-Reid | October 6, 2007[13] | October 2 – 4, 2007 | 43 | 32 | 18 | 6 |
| Angus Reid Strategies | October 5, 2007[14] | October 4 – 5, 2007 | 40 | 34 | 19 | 7 |
| Decima Research | October 2, 2007[15] | September 27 – October 1, 2007 | 43 | 32 | 14 | 10 |
| SES Research | October 2, 2007[16] | September 28 – 30, 2007 | 44 | 34 | 15 | 7 |
| Ipsos-Reid | September 29, 2007[17] | September 25 – 27, 2007 | 43 | 33 | 17 | 6 |
| Environics | September 28, 2007[18] | September 21 – 25, 2007 | 39 | 34 | 20 | 7 |
| Decima Research | September 26, 2007[19] | September 24 – 25, 2007 | 41 | 32 | 16 | 10 |
| Angus Reid Strategies | September 25, 2007[20] | September 24 – 25, 2007 | 40 | 35 | 16 | 8 |
| SES Research | September 25, 2007[21] | September 21 – 23, 2007 | 41 | 33 | 18 | 8 |
| Ipsos-Reid | September 20, 2007[22] | September 11 – 18, 2007 | 40 | 37 | 16 | 6 |
| Decima Research | September 19, 2007[23] | September 13 – 17, 2007 | 41 | 32 | 14 | 12 |
| Strategic Counsel | September 18, 2007[24] | September 13 – 16, 2007 | 40 | 34 | 16 | 10 |
| Ipsos-Reid | September 15, 2007[25] | September 4 – 13, 2007 | 40 | 37 | 16 | 6 |
| Environics | September 13, 2007[26] | September 6 – 9, 2007 | 39 | 35 | 17 | - |
| Angus Reid Strategies | September 13, 2007[27] | September 7 – 8, 2007 | 39 | 37 | 13 | 10 |
| Decima Research | September 12, 2007[28] | September 5 – 8, 2007 | 41 | 33 | 13 | 11 |
| Ipsos-Reid | September 10, 2007[29] | August 30 – September 8, 2007 | 41 | 36 | 17 | 6 |
| SES Research | August 30, 2007[30] | August 24 – 26, 2007 | 40 | 34 | 19 | 8 |
| Ipsos-Reid | August 28, 2007[31] | August 14 – 23, 2007 | 42 | 35 | 16 | 6 |
| Ipsos-Reid | August 21, 2007[32] | August 7 – 16, 2007 | 40 | 37 | 17 | 6 |
| The Strategic Counsel | August 20, 2007[33] | August 9 – 14, 2007 | 40 | 35 | 18 | 8 |
| Ipsos-Reid | July 3, 2007[34] | June 19 – 28, 2007 | 39 | 36 | 17 | 7 |
| Environics | July 2, 2007[35] | June 5 – 30, 2007 | 40 | 39 | 20 | - |
| Pollara | June 16, 2007[36] | June 7–10, 2007 | 37 | 37 | 19 | - |
| SES Research | June 3, 2007[37] | May 11–15, 2007 | 35 | 35 | 19 | 11 |
| Environics | May 18, 2007[38] | March 13–April 3, 2007 | 33 | 38 | 26 | |
| Ipsos-Reid | February 24, 2007[39] | - | 38 | 33 | 17 | 9 |
| Environics | January 5, 2007[40] | December 8–30, 2006 | 39 | 37 | 21 | - |
| SES Research | December 17, 2006[41] | November 25–27, 2006 | 42 | 35 | 16 | 7 |
| Environics | October 26, 2006[42] | September 18 – October 12, 2006 | 42 | 33 | 23 | - |
| EKOS | October 18, 2006[43] | October 10–12, 2006 | 42.4 | 36.2 | 19.6 | |
| SES Research | October 7, 2006[44] | September 30 – October 3, 2006 | 35 | 29 | 18 | 7 |
| Environics | September 9, 2006[45] | June 2–24, 2006 | 35 | 36 | 27 | - |
| Vector Research | May 14, 2006 | - | 39 | 38 | 18 | 5 |
| Environics | April 13, 2006 | - | 34 | 39 | 24 | - |
| SES Research | March 23, 2006 | - | 41 | 34 | 20 | 5 |
| Léger Marketing | March 22, 2006 | - | 34 | 34 | 20 | - |
| SES Research | February 17, 2006 | - | 41 | 37 | 18 | 4 |
| Vector Research | January 21, 2006 | - | 36 | 35 | 23 | 6 |
| Environics | October 16, 2005 | - | 42 | 35 | 21 | - |
| Vector Research | September 19, 2005 | - | 33 | 41 | 20 | 6 |
| SES Research | June 14, 2005 | - | 41 | 35 | 21 | 4 |
| Léger Marketing | June 8, 2005 | - | 42 | 34 | 17 | - |
| Léger Marketing | April 29, 2005 | - | 36 | 37 | 19 | - |
| Vector Research | April 13, 2005 | - | 35 | 41 | 18 | 5 |
| Environics | April 11, 2005 | - | 35 | 41 | 21 | - |
| Léger Marketing | March 17, 2005 | - | 44 | 33 | 19 | - |
| Vector Research | December 16, 2004 | - | 39 | 32 | 24 | 5 |
| Environics | December 2004 | - | 37 | 39 | 23 | - |
| Environics | December 11, 2004 | - | 35 | 40 | 23 | - |
| Léger Marketing | September 2004 | - | 37 | 35 | 19 | - |
| Vector Research | August 22, 2004 | - | 37 | 32 | 23 | 9 |
| Environics | August 9, 2004 | - | 35 | 37 | 23 | 4 |
| Ipsos-Reid | June 14, 2004 | - | 32 | 39 | 23 | 6 |
| SES Research | June 5, 2004 | - | 34 | 41 | 20 | - |
| Decima Research | May 27, 2004 | - | 32 | 29 | 21 | - |
| Environics | May 6, 2004 | - | 45 | 33 | 20 | 1 |
| Ipsos-Reid | April 19, 2004 | - | 45 | 30 | 19 | 5 |
| SES Research | January 23, 2004 | - | 49 | 29 | 10 | - |
| Environics | January 21, 2004 | - | 50 | 30 | 16 | 3 |
| Ipsos-Reid | December 14, 2003 | - | 51 | 27 | 16 | 6 |
| Ipsos-Reid | November 8, 2003 | - | 56 | 27 | 12 | 5 |
| Environics | October 30, 2003 | - | 49 | 29 | 18 | 2 |
| Last election (October 2, 2003) | - | 46.4 | 34.6 | 14.7 | 2.8 | |
Riding specific polls
| Riding | Polling firm | Date released | Date poll conducted | Liberal | Progressive Conservative | New Democrats | Green |
|---|---|---|---|---|---|---|---|
| Don Valley West | COMPAS | October 1, 2007[46] | September 25 – 29, 2007 | 52 | 37 | 5 | 6 |
| Bruce—Grey—Owen Sound | Oraclepoll Research | October 4, 2007[47] | October 2 – 3, 2007 | 21 | 37 | 13 | 27 |
| Nickel Belt | Oraclepoll Research | October 4, 2007[48] | October 2 – 3, 2007 | 41 | 7 | 49 | 3 |
Timeline
- May 13, 2004 - Andrea Horwath of the NDP is elected in a by-election in Hamilton East and collects over 60% of the vote. The riding was previously held by the Liberals.
- May 18, 2004 - The 2004 Ontario budget is announced. Given its tax increase and healthcare cuts, it is unpopular with the public.
- June 1, 2004 - Bill 87, which would establish fixed election dates, is introduced in the Legislative Assembly.
- August 9, 2004 - A poll by Environics shows the Liberals in second place for the first time since the last election. The NDP is also rising in support. According to the poll, the Progressive Conservatives lead with 37% followed by the Liberals with 35%, the NDP with 23% and the Greens with 4%.[49]
- September 18, 2004 - John Tory becomes leader of the Ontario Progressive Conservative Party replacing outgoing former premier Ernie Eves and defeating Jim Flaherty and Frank Klees.
- January 31, 2005 - Eves resigns his seat in the provincial legislature, clearing the way for Tory to run in the resulting by-election.
- March 17, 2005 - Tory is elected in the Dufferin—Peel—Wellington—Grey by-election, holding the seat for the Conservatives.
- March 29, 2005 - Tory is officially installed as the Leader of the Opposition.
- August 18, 2005 - Speaker Alvin Curling resigns his Scarborough—Rouge River seat to accept a diplomatic appointment. A by-election must be called within six months.
- October 26, 2005 - A by-election is called for Scarborough—Rouge River for November 24.
- November 24, 2005 - Bas Balkissoon wins in the Scarborough–Rouge River by-election, holding the seat for the Liberals.
- November 29, 2005 - Progressive Conservative MPPs Jim Flaherty, John Baird, and NDP MPP Marilyn Churley resign their seats in the provincial legislature to run for seats in the House of Commons of Canada in the 2006 federal election.
- March 1, 2006 - By-elections are called for the ridings of Toronto—Danforth, Nepean—Carleton, and Whitby—Ajax for March 30. These seats became vacant when they were resigned on November 29, 2005, so the MPPs could run in the federal election of January 2006.
- March 30, 2006 - the NDP's Peter Tabuns wins the Toronto—Danforth by-election, Progressive Conservative Lisa MacLeod wins in Nepean—Carleton, and Progressive Conservative Christine Elliott wins in Whitby-Ajax. The Liberals' star candidates in all three ridings fell short.[50]
- May 18, 2006 - Former Education Minister Gerard Kennedy resigns his Parkdale—High Park seat to pursue his bid for the federal Liberal leadership.[51]
- September 14, 2006 - Cheri DiNovo of the NDP wins the by-election to replace Liberal Gerard Kennedy in Parkdale-High Park.[52]
- September 18, 2006 - Joe Cordiano, MPP for York South—Weston, resigns from cabinet and legislature to spend more time with family.[53]
- September 25, 2006 - Tony Wong, MPP for Markham, resigns from the legislature to run for York Region council in Markham, Ontario.[54]
- September 28, 2006 - Cam Jackson, MPP for Burlington, resigns from the Legislature to run for mayor of Burlington.[55]
- January 10, 2007 - By-elections called in the ridings of: Burlington; Markham; and York South—Weston to be held on February 8, 2007.
- February 7, 2007 - The provincial government announces election date will be October 10, 2007 to avoid conflict with Shemini Atzeret on October 4.[2]
- February 8, 2007 - In three by-elections, Paul Ferreira[56] of the NDP wins York South–Weston from the Liberals while Michael Chan[57] of the Liberals and Joyce Savoline[58] of the PCs hold Markham and Burlington, respectively.
- March 29, 2007 - MPP Tim Peterson leaves the Liberal caucus and intends to run in this election as a Progressive Conservative.[59]
- April 25, 2007 - Democratic Renewal Minister Marie Bountrogianni introduces Bill 218, a bill to have longer voting hours – 9 a.m. to 9 p.m. – that identification be presented, advanced polls increased to 13 days from 6 days, and amendments regarding the referendum on election formulas for electing MPPS. The proposed legislation will also deal with suggestions for online voting and with complaints that the permanent voters' list is unreliable because it does not keep up with moves and deaths.[60]
- May 18, 2007 - New Democratic Party MPP Shelley Martel announced she will not seek re-election in her Nickel Belt riding. She is leaving politics for family reasons, and to pursue other career opportunities.[61]
- May 18, 2007 - A poll released by Environics showed the governing Liberals in second place for the first time since March 2006. According to the poll, the Progressive Conservatives lead with 39% followed by the Liberals with 33%, the NDP with 26% and the Greens with 2%. The poll was conducted between March 13 to April 3, 2007.[38]
- June 3, 2007 - A poll released by SES Research showed that the Liberals and Progressive Conservatives are in a dead-heat, with 29.8% of voters supporting each party. The NDP had 16% and the Green Party had 9%. 15% were undecided.[37]
- June 4, 2007 Today, Bill 218 is given third reading and royal assent. The bill amends the Elections Act with the following changes: making electors present proper identification; methods of updating the permanent register of electors and creating an electronic system to allow electors to change their personal information online; alternative forms of voting and electronic vote counting can now take place; scrutineers from outside an electoral district, now have the same privileges as a resident scrutineer; Ballots will now show party affiliation and any nickname or familiar name of that the candidate requests; the Chief Electoral Officer is allowed to advertise information regarding the October 2007 Referendum on electoral reform.[62]
- June 5, 2007 - Liberal Premier Dalton McGuinty prorogues the Legislature, stating that the passing of 14 bills during the session meant that the government's agenda had been fulfilled.[63] The adjournment was three weeks earlier than expected and several private members' bills failed to receive third reading, including a bill to make it mandatory to fill out organ transplant cards.[64] The legislature will not sit again until sometime after the October 10th election.[63]
- July 11, 2007 - Citing health concerns Mary Anne Chambers, the Children and Youth Services Minister and MPP for Scarborough East, will not be seeking re-election in the October 10 Ontario vote. She would have run in the Scarborough—Guildwood electoral district.[65]
- July 26, 2007 - Ontario Minister of Citizenship and Immigration Mike Colle resigned after an auditor general's report severely criticizes how $32 million in year-end grants to ethnic groups was administered.[66]
- September 10, 2007 - Official election call. Writ issued as per omnibus Budget Act, Bill 187, that includes the amendment to the Election Act to set writ issuance date. Premier McGuinty formally asked the Lt. Governor to dissolve the legislature. The campaign will be 29 days long, one day longer than the minimum.[67]

- September 18, 2007- Nomination papers due. A candidate or their designate must submit their nomination papers and deposit in person at the returning office by 2 p.m.[68]
- September 20, 2007- Televised leadership debate between McGuinty, Tory and Hampton.
- September 22 – October 4, 2007 - Advance polling stations open for early voting from 9:00 a.m. until 9:00 p.m.[62]
- October 10, 2007 - Ontario general election from 9:00 a.m. until 9:00 p.m. EDT or in the most western part of the province 8:00 a.m. to 8:00 p.m. CDT as per Provision 20, Section 40(1) and 40(2) of the Election Act.[62]
Election results
At 9:23 pm EDT, Citytv projected a Liberal majority government. CTV News made the same call at 9:30 pm EDT, followed by CBC News at 9:37 pm EDT, and Canadian Press at 9:52 pm EDT.
Also at 10:30 pm EDT, CBC and CTV reported that Progressive Conservative leader John Tory had called Liberal Leader Dalton McGuinty to concede the election. At 10:39 pm EDT, Tory was declared defeated by Canadian Press in the riding of Don Valley West.
At 10:43 pm EDT, Liberal leader Dalton McGuinty took the stage to give his speech to the public, breaking tradition of the defeated party leaders going first.
Each party lost at least one incumbent MPP — Liberals Mario Racco and Caroline Di Cocco, PCs Joe Tascona, Tim Peterson and John Tory and NDP Paul Ferreira were all defeated. However, each party's losses were offset by gains in other seats. The actual changes in party standings were accounted for entirely by the four new seats resulting from redistribution and the defeat of Peterson. Overall, however, most incumbent MPPs were returned in their ridings.
McGuinty became the first Liberal leader in Ontario to win two successive majorities in the legislature since Mitchell Hepburn in the 1937 election.
Breakdown by region
Northern Ontario
| Liberal | Progressive Conservative | New Democrats | Green | |
|---|---|---|---|---|
| Seats | 7 | 1 | 3 | 0 |
All eleven ridings in Northern Ontario were retained by their incumbent parties. The popular vote, however, shifted dramatically, with several Liberal incumbents holding on only very narrowly against NDP challengers. Most notably, Bill Mauro retained Thunder Bay—Atikokan by a margin of just 36 votes against John Rafferty, whom Mauro had defeated in 2003 by a margin of over 11,000 — Rafferty, in fact, spent much of the night leading Mauro. A judicial recount on October 31 increased Mauro's margin of victory to 50 votes. David Ramsay, similarly, trailed New Democrat John Vanthof in Timiskaming—Cochrane for much of the night, pulling ahead to a winning margin of 634 votes only in the final few polls to report. This was the narrowest margin of victory in Ramsay's 22-year career. Michael Gravelle also retained Thunder Bay—Superior North by an uncharacteristically narrow margin over Jim Foulds.
As well, Monique Smith retained Nipissing by just 377 votes over Progressive Conservative candidate Bill Vrebosch — in 2003, she had defeated Progressive Conservative incumbent Al McDonald by a wider margin of over 3,000 votes.
In keeping with this trend, New Democrat incumbents Howard Hampton and Gilles Bisson widened their margins of victory over Liberal challengers compared to 2003, and France Gélinas maintained the same margin that her predecessor, Shelley Martel, had attained in the previous election.
Notably, the rise in popular support for the New Democrats in Northern Ontario carried over into the 2008 federal election, in which the NDP won nearly every seat in the region for the first time in its history.
Eastern Ontario
| Liberal | Progressive Conservative | New Democrats | Green | |
|---|---|---|---|---|
| Seats | 9 | 5 | 0 | 0 |
In Eastern Ontario, the new riding of Lanark—Frontenac—Lennox and Addington was carried by PC candidate Randy Hillier, while all 13 existing ridings were carried by their incumbent parties. With the exception of Yasir Naqvi, who carried Ottawa Centre by a much smaller margin over the NDP than Richard Patten had attained in 2003, Liberals in Ottawa improved their winning margins, although outside of Ottawa the popular vote trend remained relatively stable.
Central Ontario
| Liberal | Progressive Conservative | New Democrats | Green | |
|---|---|---|---|---|
| Seats | 3 | 8 | 0 | 0 |
The most conservative-friendly area of the province, the PC vote largely held up, with the only Liberal gain being Aileen Carroll winning Barrie, the seat she used to represent federally. This was countered by a PC nominal gain in Newmarket—Aurora. The area also delivered the strongest support in the province for the Green Party, with Shane Jolley finishing a very strong second in Bruce—Grey—Owen Sound with 33.1% of the vote, the best finish ever received by any Green candidate in Canada to that point. The Greens also knocked the NDP into fourth place in a majority of area ridings.
Midwestern Ontario
| Liberal | Progressive Conservative | New Democrats | Green | |
|---|---|---|---|---|
| Seats | 6 | 5 | 0 | 0 |
A politically mixed region, Midwestern Ontario had every incumbent party re-elected, as well as some anomalous results; in an election where the PCs were largely held to rural areas, and the Liberals consolidated an urban/suburban base, Elizabeth Witmer held onto the riding of Kitchener—Waterloo for the PCs, while the Liberals won in rural ridings in which they were the incumbent party, such as Huron—Bruce and Perth—Wellington. Further away from the provincewide result, on an election night which demonstrated Liberal strength province wide, Haldimand—Norfolk—Brant delivered the most crushing defeat for a Liberal candidate in the province, with the victorious PC incumbent Toby Barrett coming out 16,571 votes and 38.6% ahead of the Liberal.
Brampton, Mississauga & Oakville
| Liberal | Progressive Conservative | New Democrats | Green | |
|---|---|---|---|---|
| Seats | 9 | 0 | 0 | 0 |
Although the suburban Western GTA had traditionally been a good area for the PCs, winning many seats in the area as recently as the Harris days, where it formed part of the 905-area backbone of the PC government, the Liberals won every seat in the area handily, with the victorious Liberal candidates averaging at around 50%. Even Mississauga South, which prior to the 2003 election had not voted Liberal provincially since the riding's creation, and had been expected to be a very tight race, proved a surprisingly easy victory for Charles Sousa, who gained the seat back for the Liberals from Tim Peterson, who had crossed the floor. The NDP continued to be a non-factor in the area, while the Greens growth in popular vote across the province was reflected, with the Greens even beating the NDP into fourth place in Oakville, which ironically had been the only riding in the province the Greens had not run in the previous election.
Southern Durham and York
| Liberal | Progressive Conservative | New Democrats | Green | |
|---|---|---|---|---|
| Seats | 6 | 3 | 0 | 0 |
The Liberals continued to dominate York Region, with each incumbent being re-elected by a comfortable margin except in Thornhill where Mario Racco lost to PC candidate Peter Shurman. The newly created riding of Ajax—Pickering, projected to be a close race, elected Liberal Joe Dickson by over 6,000 votes despite having no party nominate incumbents. In southern Durham Region, Liberal Wayne Arthurs was re-elected to the newly distributed Pickering—Scarborough East, while Progressive Conservative Christine Elliott was re-elected to Whitby—Oshawa. Despite high expectations for Sid Ryan's fourth run as an NDP candidate in Oshawa, PC incumbent Jerry Ouellette was again re-elected by a wider majority than in 2003.
Hamilton, Burlington & Niagara
| Liberal | Progressive Conservative | New Democrats | Green | |
|---|---|---|---|---|
| Seats | 4 | 3 | 3 | 0 |
An area with several close seats, and a fairly even distribution of seats, every party had a realistic chance of increasing its seat count here. Hamilton East—Stoney Creek, which was a merger of a Liberal held riding and an NDP held riding, and had neither incumbent running, was the most interesting match of the night, with the NDP winning a close race. It proved to be the only change of the election, and every other riding returned the incumbent party, although many in close races, such as Hamilton Mountain (Liberals over NDP), Halton, (PCs over Liberals) and Burlington (PCs over Liberals).
Southwestern Ontario
| Liberal | Progressive Conservative | New Democrats | Green | |
|---|---|---|---|---|
| Seats | 9 | 1 | 0 | 0 |
In an area with a strong rural-urban divide, both the NDP and PCs had strong hopes of making gains against the Liberals. The NDP had strong hopes of upsetting high-profile Liberals in both Windsor West, and Windsor—Tecumseh, given the NDP's ownership of those seats federally, and the continued decline of the local industrial economy. London—Fanshawe was similarly also a top target, as the NDP had the riding federally and finished a close second in 2003. Overall, however, the only area seat that changed hands was Sarnia—Lambton, with Culture Minister Caroline Di Cocco, the most high-profile Liberal casualty of the night, losing to PC challenger Bob Bailey.
Toronto
| Liberal | Progressive Conservative | New Democrats | Green | |
|---|---|---|---|---|
| Seats | 18 | 0 | 4 | 0 |
All ridings in Toronto were retained by their incumbent parties, with the exception of York South—Weston. New Democrat Paul Ferreira, who had won the seat from the Liberals in a by-election in February 2007, was narrowly defeated by a swing back to Liberal candidate Laura Albanese. Almost twice as many people voted in the riding in the general election compared to the by-election.
In Toronto's other notable race, Liberal incumbent Kathleen Wynne defeated PC leader John Tory in Don Valley West. Tory previously represented Dufferin—Caledon, but had chosen to run in a Toronto riding in the general election.
Toronto's only incumbent from 2003 not to run again was Liberal MPP Mary Anne Chambers. The Liberals successfully retained the seat under new candidate Margarett Best.
See also
References
Notes
- ↑ Tory represented Dufferin—Peel—Wellington—Grey in the previous legislature though did not seek re-election, opting to run in Don Valley West instead.
Citations
- ↑ "Boring campaign behind poor voter turnout: analysts". CTV News. Toronto. October 11, 2007. Archived from the original on May 29, 2014. Retrieved May 28, 2014.
- 1 2 3 Howlett, Karen (February 7, 2007). "Ontario government changes election date". Toronto: The Globe and Mail Newspaper. pp. Online update. Archived from the original on June 5, 2014. Retrieved May 28, 2014.
- ↑ "Electoral System Referendum Act, 2007, S.O. 2007, c. 1 - Bill 155". July 24, 2014.
- ↑ Alphonso, Caroline (September 10, 2007). "Ontario campaign starts with verbal attacks". The Globe and Mail. Archived from the original on May 29, 2014. Retrieved May 28, 2014.
- ↑ "Progressive Conservatives to soften position on faith-based schools: report". Archived from the original on October 12, 2007. Retrieved October 11, 2007.
- ↑ Christ Selley (November 21, 2015). "Progressive Conservatives to soften position on faith-based schools: report". The National Post.
- ↑ Robin V. Sears (November 1, 2007). "How Ontario got a one-issue campaign". Archived from the original on March 12, 2018. Retrieved March 12, 2018.
- 1 2 3 "Electoral Districts". Elections Ontario Website. Elections Ontario, Government of Ontario. 2005. Archived from the original on September 27, 2007. Retrieved August 22, 2007.
- ↑ "Liberals ride lead in polls while PC school funding flip fails to boost support" (PDF) (Press release). SES Research/Sun Media. October 9, 2007. Archived (PDF) from the original on October 25, 2007. Retrieved October 9, 2007. The poll results, based on a one-week sample of 709 Ontarians, have a margin of error of 3.7 per cent, 19 times out of 20.
- ↑ "Liberal Victory Imminent" (PDF) (Press release). SES Research/Sun Media. October 9, 2007. Archived (PDF) from the original on October 25, 2007. Retrieved October 9, 2007. Between October 4 and 6, 2006, random telephone survey with 501 Ontarians 18 years of age or older. The aggregate survey results are plus or minus 4.4%, 19 times out of 20. Margins of accuracy are wider for subgroup samples.
- ↑ "Ontario Liberals Headed for Majority Government" (Press release). Environics. October 9, 2007. Archived from the original on October 12, 2007. Retrieved October 9, 2007. These results are taken from an Environics survey of 448 Ontarians eligible to vote, conducted between September 28 and October 2, 2007. The poll was conducted independently. On a provincial basis, these results are accurate to within +/- 4.7 percentage points, in 95 out of 100 samples. Green column includes other parties.
- ↑ "Poll says Ontario Liberals have 15-point lead" (Press release). Strategic Counsel/CTV News/The Globe and Mail. October 8, 2007. Archived from the original on October 17, 2007. Retrieved October 8, 2007. Interviews were conducted between Oct. 6 and Oct. 7, 2007. Results are based on tracking among a proportionate sample of Ontarians 18 years of age or older. A total of 850 Ontarians were surveyed. The Ontario margin of error is plus or minus 3.4 percentage points, 19 times out of 20.
- ↑ "Tory's Gambit Fails: Grits Headed For Majority Government" (Press release). Ipsos-Reid/CanWest/National Post. October 6, 2007. Archived from the original on October 10, 2007. Retrieved October 6, 2007. These are the findings of an Ipsos Reid poll conducted exclusively for CanWest News Service and Global Television from October 2–4, 2007. For the survey, a representative randomly selected sample of 800 adults living in Ontario was interviewed by telephone. With a sample of this size, the results are considered accurate to within ± 3.5 percentage points, 19 times out of 20, of what they would have been had the entire adult population living in Ontario been polled. The margin of error will be larger within regions and for other sub-groupings of the survey population. These data were weighted to ensure that the sample's regional and age/sex composition reflects that of the actual Ontarian population according to Census data. Ipsos Reid’s companion poll was conducted on October 4–6, when a sample of 4241 adult was surveyed online via Ipsos’ I-Say Panel. With a sample of this size, the results are considered accurate to within ± 1.5 percentage points, 19 times out of 20, of what they would have been had the entire adult population living in Ontario been polled. These data were weighted to ensure that the sample's regional and age/sex composition reflects that of the actual Ontarian population according to Census data. There were 4% undecided.
- ↑ "Ontario Liberals Hold Six-Point Advantage: Tory's Leadership Edge Evaporates; Now Tied with McGuinty" (PDF). Ontario Politics. Angus-Reid Strategies. October 5, 2007. Archived from the original (PDF) on October 25, 2007. Retrieved October 5, 2007. From October 4 to 5, 2007, Angus Reid Strategies conducted an online survey among a randomly selected, representative sample of 939 adults in Ontario. The margin of error for the total sample is +/- 3.2%, 19 times out of 20. The results have been statistically weighted according to the most current education, age, gender and region Census data to ensure a sample representative of the entire adult population of Ontario. Discrepancies in or between totals are due to rounding. Voter intent: Notably, 10 per cent of the Ontario electorate remains undecided, 10 per cent say they will not vote, and 30 per cent (-9) say they could change their mind between now and Election Day.
- ↑ "Liberal lead firming" (PDF). The Canadian Press/Harris-Decima. October 2, 2007. Archived from the original (PDF) on October 25, 2007. Retrieved October 3, 2007.Results of the survey of 701 residents, with its margin of error of 3.7 percentage points 19 times out of 20.
- ↑ "Grits Move Into Majority Territory" (PDF) (Press release). SES Research/Sun Media. October 2, 2007. Archived (PDF) from the original on October 25, 2007. Retrieved October 2, 2007. The aggregate survey results, or results including the undecided voters were: Libs 39.6%; Cons 30.6%; NDP 13.5%; Greens 6.3%; Undecided 10%. The aggregate survey is accurate ± 4.4% 19 times out of 20. Margins of accuracy are wider for subgroup samples. The data was weighted for gender and age to match the Canadian census results for Ontario. Result should be considered representative of the Ontario population. 500 Ontarians were surveyed. Number of Committed voters was 450, undecided voters were 50, or 10%. With just the committed voters the results are: Libs 44; Cons 34; NDP 15; Greens 7. The margin of error increases to ± 4.7%, 19 times out of 20. The results shown in the table are for the committed voters only.
- ↑ "Post Debate Tory Tumble Gives McGuinty Liberals Ten Point Lead" (Press release). Ipsos-Reid/CanWest/National Post. September 29, 2007. Archived from the original on October 10, 2007. Retrieved September 29, 2007. These are the findings of an Ipsos Reid poll conducted exclusively for CanWest News Service and Global Television from Sep 25 to September 27, 2007. For the survey, a representative randomly selected sample of 800 adults living in Ontario was interviewed by telephone. With a sample of this size, the results are considered accurate to within ± 3.5 percentage points, 19 times out of 20, of what they would have been had the entire adult population living in Ontario been polled. The margin of error will be larger within regions and for other sub-groupings of the survey population. These data were weighted to ensure that the sample's regional and age/sex composition reflects that of the actual Ontarian population according to Census data.
- ↑ "Opposition grows to funding faith-based schools, but issue has little impact on vote intention" (Press release). Environics. September 28, 2007. Archived from the original on October 11, 2007. Retrieved September 28, 2007. Between September 21st and September 25th, 2007, Environics conducted a random telephone survey of 504 Ontarians 18 years and older. The aggregate survey results are accurate ±4.4%, 19 times out of 20.
- ↑ "Voting intentions stuck" (PDF). Ontario Politics. Canadian Press/Harris Decima. September 26, 2007. Archived from the original (PDF) on October 25, 2007. Retrieved September 28, 2007. it surveyed 706 respondents and has a margin of error of ± 3.7 per cent, 19 times out of 20 - are virtually identical to the previous week's findings.
- ↑ "McGuinty's Grits Lead by Five Points in Ontario" (PDF). Ontario Politics. Angus-Reid Strategies. September 25, 2007. Archived from the original (PDF) on October 25, 2007. Retrieved September 26, 2007. Online interviews with 800 Ontario adults, conducted on Sept. 24 and Sept. 25, 2007. Margin of error is 3.5 per cent. Notably, 15 per cent of the Ontario electorate remains undecided and 39 per cent (-11) say they could change their mind between now and Election Day.
- ↑ Nanos, Nikita (September 25, 2007). "Grits Lead by Eight Points" (PDF). Ontario Politics. SES Research/Sun Media. Archived (PDF) from the original on September 26, 2007. Retrieved September 25, 2007. The aggregate survey results, or results including the undecided voters were: Libs 35; Cons 27; NDP 15; Greens 7; Undecided 14. The aggregate survey is accurate ± 4.4% 19 times out of 20. Margins of accuracy are wider for subgroup samples. The data was weighted for gender and age to match the Canadian census results for Ontario. Result should be considered representative of the Ontario population. 500 Ontarians were surveyed. Number of Committed voters was 433, undecided voters were 67, or 14%. With just the committed voters the results are: Libs 41; Cons 33; NDP 18; Greens 8. The margin of error increases to ± 4.9%, 19 times out of 20. The results shown in the table are for the committed voters only.
- ↑ "Will Hot Debate Thaw Frozen Voters?" (Press release). Ipsos-Reid/CanWest/National Post. September 20, 2007. Archived from the original on December 21, 2016. Retrieved September 20, 2007. These are the findings of an Ipsos Reid poll conducted exclusively for CanWest News Service and Global Television from September 11 to September 18, 2007. For the survey, a representative randomly selected sample of 800 adults living in Ontario was interviewed by telephone. With a sample of this size, the results are considered accurate to within ±3.5 percentage points, 19 times out of 20, of what they would have been had the entire adult population living in Ontario been polled. The margin of error will be larger within regions and for other sub-groupings of the survey population. These data were weighted to ensure that the sample's regional and age/sex composition reflects that of the actual Ontarian population according to Census data.
- ↑ Perkel, Colin (September 19, 2007). "Liberals maintain lead over Tories in latest poll". Toronto: The Canadian Press/Harris-Decima. Archived from the original on December 21, 2016. Retrieved September 19, 2007.Results of the survey of 704 residents, with its margin of error of 3.7 percentage points 19 times out of 20, is substantially similar to a poll done for The Canadian Press in the days just before the campaign formally got underway Sept. 10
- ↑ Howlett, Karen (September 18, 2007). "Ontario voters pan faith-based education: poll". Toronto: CTV News/The Globe and Mail. Archived from the original on May 29, 2014. Retrieved May 28, 2014. The survey of 850 Ontarians was conducted from Sept. 13 to Sept. 16, and is considered accurate to within 3.4 percentage points, 95 per cent of the time.
- ↑ "Ontario vote essentially stagnant after 1st week" (Press release). Ipsos-Reid/CanWest/National Post. September 15, 2007. Archived from the original on October 10, 2007. Retrieved September 16, 2007. These are the findings of an Ipsos Reid poll conducted exclusively for CanWest News Service and Global Television from Sep 4 to September 13, 2007. For the survey, a representative randomly selected sample of 800 adults living in Ontario was interviewed by telephone. With a sample of this size, the results are considered accurate to within ± 3.5 percentage points, 19 times out of 20, of what they would have been had the entire adult population living in Ontario been polled. The margin of error will be larger within regions and for other sub-groupings of the survey population. These data were weighted to ensure that the sample's regional and age/sex composition reflects that of the actual Ontarian population according to Census data.
- ↑ "Ontarians divided over proposal to extend public funding to all religious schools" (Press release). Environics. September 13, 2007. Archived from the original on October 3, 2007. Retrieved September 14, 2007. These results are taken from an Environics survey of 501 Ontarians aged 18 and older, conducted between September 6 and 9, 2007. The poll was conducted independently. On a provincial basis, these results are accurate to within +/-4.38 percentage points, in 95 out of 100 samples.The Green party again was not a prompt. Instead, in the poll, it lists 9% of voters would pick 'Other'. The poll also found that 21% of voters in the survey were undecided. The poll asked questions about funding faith-based schools, and found the electorate is roughly split down the middle. The question wordings were: (1) If a provincial election were held today, which one of the following parties would you vote for? (2) ([If "Undecided" ask) Perhaps you have not yet made up your mind; is there nevertheless a party you might be presently inclined to support?
- ↑ "Liberals Lead by Two Points in Ontario". Polls & Research. Angus Reid Global Monitor. September 14, 2007. Archived from the original on October 12, 2007. Retrieved September 14, 2007. Source: Angus Reid Strategies. Methodology: Online interviews with 725 Ontario adults, conducted on Sept. 7 and Sept. 8, 2007. Margin of error is 3.6 per cent. PDF file is available here "Archived copy" (PDF). Archived from the original (PDF) on September 26, 2007. Retrieved September 14, 2007.
{{cite web}}: CS1 maint: archived copy as title (link) - ↑ Perkel, Colin (September 12, 2007). "Liberals lead Conservatives in poll". Decima Research/Toronto Star. Archived from the original on October 11, 2007. Retrieved September 12, 2007. The poll's margin of error is 3.7 percentage points, 19 times out of 20. But the pollsters also combined the survey with polling conducted during the previous two weeks, creating a rolling average with an error margin of about 3.1 percentage points.
- ↑ "Liberal lead over Tories slipping in Ontario: poll". Ipsos-Reid/CanWest/National Post. September 10, 2007. Archived from the original on January 18, 2013. Retrieved September 10, 2007. The Ipsos Reid telephone poll was conducted with a random sample of 801 respondents between Aug. 30 and Sept. 8. The results are considered accurate within 3.5 percentage points, 19 times out of 20.
- ↑ Nanos, Nikita (August 30, 2007). "Ontario grits lead by six points" (PDF). Ontario Politics. SES Research/Sun Media. Archived (PDF) from the original on September 26, 2007. Retrieved August 30, 2007. The aggregate survey results, or results including the undecided voters were: Libs 34; Cons 28; NDP 16; Greens 7; Undecided 15. The aggregate survey is accurate ± 4.4% 19 times out of 20. Margins of accuracy are wider for subgroup samples. The data was weighted for gender and age to match the Canadian census results for Ontario. Result should be considered representative of the Ontario population. 501 Ontarians were surveyed. Number of Committed voters was 425, undecided voters were 76, or 15%. With just the committed voters the results are: Libs 40; Cons 34; NDP 19; Greens 8. The margin of error increases to ± 4.9%, 19 times out of 20. The results shown in the table are for the committed voters only.
- ↑ "As the Ontario Election Draws Near, The GTA moves Red while the Rest of Ontario moves Blue". CanWest Polls. Ipsos-Reid/CanWest. September 10, 2007. Archived from the original on October 10, 2007. Retrieved August 21, 2007. These are the findings of an Ipsos Reid poll conducted exclusively for CanWest News Service and Global Television from Aug 14 to Aug 23, 2007. For the survey, a representative randomly selected sample of 760 adults living in Ontario was interviewed by telephone. With a sample of this size, the results are considered accurate to within ± 3.6 percentage points, 19 times out of 20, of what they would have been had the entire adult population living in Ontario been polled. The margin of error will be larger within regions and for other sub-groupings of the survey population. These data were weighted to ensure that the sample's regional and age/sex composition reflects that of the actual Ontarian population according to Census data
- ↑ "As the Ontario Election Draws Near, The GTA moves Red while the Rest of Ontario moves Blue". CanWest Polls. Ipsos-Reid/CanWest. August 21, 2007. Archived from the original on September 27, 2007. Retrieved August 21, 2007. For the survey, a representative randomly selected sample of 800 adults living in Ontario was interviewed by telephone. With a sample of this size, the results are considered accurate to within ±3.5 percentage points, 19 times out of 20, of what they would have been had the entire adult population living in Ontario been polled. The margin of error will be larger within regions and for other sub-groupings of the survey population. These data were weighted to ensure that the sample's regional and age/sex composition reflects that of the actual Ontarian population according to Census data.
- ↑ Howlett, Karen (August 20, 2007). "McGuinty support slips to minority status, poll finds". Ontario Politics. Toronto: The Globe and Mail/CTV News. Archived from the original on September 6, 2008. Retrieved August 20, 2007. The poll of 750 Ontarians is considered accurate to within 3.6 percentage points, 95 per cent of the time.
- ↑ "Race Tightens as Summer Heats Up" (PDF). Ipsos-Reid/CanWest Polls. July 3, 2007. Archived from the original (PDF) on July 10, 2007. Retrieved July 8, 2007. For the survey, a representative randomly selected sample of 801 adults living in Ontario was interviewed by telephone. With a sample of this size, the results are considered accurate to within ±3.5 percentage points, 19 times out of 20, of what they would have been had the entire adult population living in Ontario been polled.
- ↑ "Provincial Party Support March 2007" (Press release). Environics. July 2, 2007. Archived from the original on August 22, 2007. Retrieved September 10, 2007. The previous results are based on a survey conducted by telephone between June 5 and 30, 2007 among a probability sample of 2,021 adult residents of Canada (aged 18 or older). The sample, which was stratified by region and by community size, is estimated to be accurate within 2.2 percentage points, 19 times out of 20. The question wordings were: (1) If a provincial election were held today, which one of the following parties would you vote for? (2) ([If "Undecided" ask) Perhaps you have not yet made up your mind; is there nevertheless a party you might be presently inclined to support?
- ↑ Kalinoswski, Tess (June 16, 2007). "A $17,5B transit promise". The Toronto Star. Archived from the original on February 3, 2015. Retrieved June 18, 2007. 1001 people were canvassed with 15% undecided. Poll is accurate to within 3.1%, 19 times out of 20.
- 1 2 "Ontario Liberals and PCs in Dead Heat" (PDF) (Press release). SES Research. June 3, 2007. Archived (PDF) from the original on June 14, 2007. Retrieved June 10, 2007.The aggregate survey results, or results including the undecided voters were: Libs 30; Cons 30; NDP 16; Greens 9; Undecided 15. The aggregate survey is accurate ± 4.4% 19 times out of 20. Margins of accuracy are wider for subgroup samples. The data was weighted for gender and age to match the Canadian census results for Ontario. Result should be considered representative of the Ontario population. 500 Ontarians were surveyed. Number of Committed voters was 424, undecided voters were 76, or 15%. With just the committed voters the results are: Libs 40; Cons 34; NDP 19; Greens 8. The margin of error increases to ± 4.9%, 19 times out of 20. The results shown in the table are for the committed voters only.
- 1 2 "Provincial Party Support March 2007" (Press release). Environics. May 18, 2007. Archived from the original on May 29, 2007. Retrieved May 23, 2007.
- ↑ "Ontario Politics With Just Over 7 Months To "E" Day Liberals(38%) Lead Tories (33%), NDP (17%) And Green (9%)" (Press release). Ipsos-Reid. February 24, 2007. Archived from the original on September 27, 2007. Retrieved May 23, 2007.
- ↑ "Provincial Party Support December 2006" (Press release). Environics. January 5, 2007. Archived from the original on June 29, 2007. Retrieved June 10, 2007. The sample of 2045 adult residents of Canada, which was stratified by region and by community size, is estimated to be accurate within 2.2 percentage points, 19 times out of 20.
- ↑ "Ontario Political Landscape" (PDF) (Press release). SES Research. December 17, 2006. Archived (PDF) from the original on June 14, 2007. Retrieved June 10, 2007. The aggregate survey results, or results including the undecided voters were: Libs 36; Cons 30; NDP 14; Greens 6; Undecided 14. The aggregate survey is accurate ± 4.4% 19 times out of 20. Margins of accuracy are wider for subgroup samples. The data was weighted for gender and age to match the Canadian census results for Ontario. Result should be considered representative of the Ontario population. 500 Ontarians were surveyed. Number of Committed voters was 429, undecided voters were 71, or 14%. With just the committed voters the results are: Libs 40; Cons 34; NDP 19; Greens 8. The margin of error increases to ± 4.7%, 19 times out of 20. The results shown in the table are for the committed voters only.
- ↑ "Ontario Liberals establish solid lead" (Press release). Environics. October 26, 2006. Archived from the original on September 27, 2007. Retrieved June 10, 2007. The sample of 579 adult eligible voters in Ontario, is estimated to be accurate within +/- 4.1% points, 95 times out of 100 samples. 2% would vote for other parties, while 12% had no preference.
- ↑ "Ontario Liberals With Clear Lead" (Press release). EKOS. October 18, 2006. Archived from the original on June 1, 2007. Retrieved June 10, 2007. 584 Ontarians were polled. Decided voters were 492. 1.8 percent of respondents would vote for "Other", which includes the Green Party. Sample size produces a statistical margin of error of +/-4.1%, 19 times out of 20.
- ↑ "Ontario Liberals Lead by Seven Points" (PDF) (Press release). SES Research. October 7, 2006. Archived (PDF) from the original on June 14, 2007. Retrieved June 10, 2007. 500 voting age Ontarians were polled. Sample is accurate to within plus or minus 4.4% 19 times out of 20. 11% undecided.
- ↑ "Provincial Party Support results June 2006" (Press release). Environics. September 9, 2006. Archived from the original on January 5, 2007. Retrieved June 11, 2007. The sample of 2036 adult residents of Canada, which was stratified by region and by community size, is estimated to be accurate within 2.2 percentage points, 19 times out of 20. 1% preferred other parties, while 8% had no party preference.
- ↑ "Liberal Minister Kathleen Wynne Leading by Wide Margin: PC Schooling Promise Stirs Unease about Integrating Immigrants" (PDF) (Press release). COMPAS/Ottawa Citizen. October 1, 2007. Archived (PDF) from the original on October 25, 2007. Retrieved October 6, 2007. An Ottawa Citizen/COMPAS poll in John Tory’s riding of Don Valley West was carried out carefully over a five-day period, September 25–29, 2007, to minimize the risk of sampling error. It shows the Liberal incumbent with a 15% lead over the PC leader, as shown in table 1. By convention, the poll of 333 voters is deemed accurate to within approximately 5.6 percentage points 19 times out of 20.
- ↑ http://www.gpo.ca/sites/greenparty.on.ca/files/Bruce%20Grey%20Owen%20Sound%20Riding%20Report.doc%5B%5D
- ↑ The Sudbury Star - Ontario, CA
- ↑ "Provincial Tories Tied with McGuinty Liberals – NDP also Gains Ground" (Press release). Environics. August 9, 2004. Archived from the original on September 27, 2007. Retrieved May 23, 2007.
- ↑ "March 30 By-elections - Unofficial Results". Elections Ontario. March 30, 2006. Archived from the original on April 20, 2006.
- ↑ "Gerard Kennedy resigns from Ontario legislature". CTV. May 18, 2006. Archived from the original on October 12, 2007. Retrieved May 23, 2007.
- ↑ "Official results Parkdale–High Park by-election". 2006 By-elections. Elections Ontario. September 14, 2006. Archived from the original on June 27, 2007. Retrieved May 23, 2007.
- ↑ Urquhart, Ian (September 27, 2006). "Passing ships firing cannonballs at McGuinty". Opinions. The Toronto Star. p. A13. Archived from the original on October 1, 2007. Retrieved May 23, 2007.
- ↑ Benzie, Robert (September 26, 2006). "Tony Wong hopes to return to region". News. Markham Economist & Sun. Archived from the original on October 1, 2007. Retrieved May 23, 2007.
- ↑ Cox, Christine (September 29, 2006). "Jackson joins race for Burlington mayor". Local. The Hamilton Spectator. Archived from the original on October 1, 2007. Retrieved May 23, 2007.
- ↑ Elections Ontario, Unofficial results [York South—Weston]. 216 of 216 polls reporting. Accessed February 8, 2007
- ↑ Elections Ontario, Unofficial results [Markham]. 295 of 295 polls reporting. Accessed February 8, 2007
- ↑ Elections Ontario, Unofficial results [Burlington]. 260 of 260 polls reporting. Accessed February 8, 2007
- ↑ Benzie, Robert; Rob Ferguson (March 29, 2007). "MPP Peterson, brother of ex-premier, to join Tories". News. The Toronto Star. Archived from the original on March 5, 2016. Retrieved May 23, 2007.
- ↑ Campbell, Murray (April 25, 2007). "Ontario acts to undo electoral apathy". The Globe and Mail. Toronto. Archived from the original on June 5, 2014. Retrieved May 28, 2014.
- ↑ Ferguson, Rob (May 18, 2007). "MPP Shelley Martel won't run again". The Toronto Star. Archived from the original on March 7, 2016. Retrieved May 18, 2007.
- 1 2 3 "An Act to amend the Election Act and the Election Finances Act and to make related amendments to other Acts" (PDF). Second Session of the Ontario's 38th Legislature. Legislative Assembly of Ontario. June 4, 2007. Archived from the original (PDF) on June 14, 2007. Retrieved June 10, 2007.
- 1 2 Howlett, Karen (June 6, 2007). "McGuinty admits health tax will haunt him". The Globe and Mail. Toronto. Archived from the original on June 5, 2014. Retrieved May 28, 2014.
- ↑ Canadian Press (June 4, 2007). "Slew of bills set to die as Queen's Park prepares to adjourn". The Globe and Mail. Toronto. Retrieved June 10, 2007.
- ↑ Benzie, Robert (July 11, 2007). "Chambers won't run again". The Toronto Star. Archived from the original on September 29, 2007. Retrieved July 11, 2007.
- ↑ Cohen, Tobi; Puxley, Chinta; Canadian Press (July 26, 2007). "Minister quits over grants". News. The Toronto Star. Archived from the original on September 3, 2014. Retrieved July 26, 2007.
- ↑ Campbell, Murray (April 28, 2007). "Ontario election to be called Sept. 10". The Globe and Mail. Toronto. Archived from the original on June 5, 2014. Retrieved May 28, 2014.
- ↑ "Candidates' election calendar". Elections Ontario. Archived from the original on September 28, 2007. Retrieved August 20, 2007.
Further reading
- Mutimer, David, ed. (2014). Canadian Annual Review of Politics and Public Affairs, 2007. Toronto: University of Toronto Press. ISBN 9781442648555.
External links
Elections Ontario
Canadian news/media networks
Blogs and forecasters
- DemocraticSPACE Ontario 2007 Coverage
- Electionprediction.com: Ontario Election - 2007
- Election Almanac - Ontario Provincial Election
- Paulitics 2007 Ontario Election Projections (Antweiler Application & Universal Swing Model)
- Pollingreport.ca - Ontario Political Situation
- TrendLines 2007 Ontario & Federal Riding Projections (includes table of 10 model predictions and how they fared on Election Day)
- Professor Antweiler's Voter Migration Election Forecaster - Ontario 2007 Election
| General elections | |
|---|---|
| By-elections | |
| Municipal elections | |
| Referendums | |