| |||||||||||||||||||||||||||||||||||||||||||||
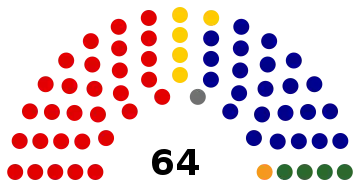
All 64 seats in the Australian Senate 33 seats needed for a majority | |||||||||||||||||||||||||||||||||||||||||||||
|---|---|---|---|---|---|---|---|---|---|---|---|---|---|---|---|---|---|---|---|---|---|---|---|---|---|---|---|---|---|---|---|---|---|---|---|---|---|---|---|---|---|---|---|---|---|
| |||||||||||||||||||||||||||||||||||||||||||||
 Senators elected in the 1983 federal election | |||||||||||||||||||||||||||||||||||||||||||||
| |||||||||||||||||||||||||||||||||||||||||||||


The following tables show state-by-state results in the Australian Senate at the 1983 Australian federal election. Senators total 25 coalition (23 Liberal, one coalition National, one CLP), 30 Labor, three non-coalition National, five Democrats, and one Independent.[1] Senate terms are six years (three for territories). As the election was the result of a double dissolution, all 64 senate seats were vacant. All elected senators took their seats immediately with a backdated starting date of 1 July 1982, except for the territorial senators who took their seats at the election. Half of the senators elected in each state were allocated 3-year terms (from 1 July 1982) to restore the rotation. It is the most recent federal Senate election won by the Labor Party.
Australia
 | ||||||||
|---|---|---|---|---|---|---|---|---|
| Party | Votes | % | Swing | Seats won | Total seats | Change | ||
| Labor | 3,637,316 | 45.49 | +3.24 | 30 | 30 | +3 | ||
| Liberal–National coalition | 3,195,397 | 39.97 | –3.51 | 28 | 28 | –3 | ||
| Liberal–National joint ticket | 1,861,618 | 23.28 | −2.35 | 8 | * | * | ||
| Liberal (separate ticket) | 923,571 | 11.55 | −1.59 | 16 | 23 | –4 | ||
| National (separate ticket) | 388,802 | 4.86 | +0.41 | 3 | 4 | +1 | ||
| Country Liberal | 21,406 | 0.27 | +0.02 | 1 | 1 | 0 | ||
| Democrats | 764,911 | 9.57 | +0.31 | 5 | 5 | 0 | ||
| Call to Australia | 96,065 | 0 | ||||||
| Progress Party | 1,905 | 0 | ||||||
| White Australia | 1,025 | 0 | ||||||
| Independents | 193,454 | 2.42 | +1.29 | 1 | 1 | 0 | ||
| Other | 203,967 | 2.55 | −1.34 | 0 | 0 | 0 | ||
| Total | 7,995,045 | 64 | 64 | |||||
New South Wales
|
| ||||||||||||||||||||||||||||||||||||||||||||||||||||||||||||||||||||||||||||||||||||||||||||||||||||||||||||||||||||||||||||||||||||||||||||||||||||||||||||||||||||||||||||||||||||||||||||||||||||||||||||||||||||||||||
Victoria
|
| ||||||||||||||||||||||||||||||||||||||||||||||||||||||||||||||||||||||||||||||||||||||||||||||||||||||||||||||||||||||||||||||||||||||||||||||||||||||||||||||||||||||||||||||||||||||||||||||||||
Queensland
|
| ||||||||||||||||||||||||||||||||||||||||||||||||||||||||||||||||||||||||||||||||||||||||||||||||||||||||||||||||||||||||||||||||||||||||||||||||||||||||||||||||||||||||||||||||
Western Australia
|
| ||||||||||||||||||||||||||||||||||||||||||||||||||||||||||||||||||||||||||||||||||||||||||||||||||||||||||||||||||||||||||||||||
South Australia
|
| ||||||||||||||||||||||||||||||||||||||||||||||||||||||||||||||||||||||||||||||||||||||||||||||||||||||||||||||||||||||||||||||||||||||||||||
Tasmania
|
| ||||||||||||||||||||||||||||||||||||||||||||||||||||||||||||||||||||||||||||||||||||||||||||||||||
Australian Capital Territory
|
| ||||||||||||||||||||||||||||||||||||||||||||||||||||||||||||||||||||||||
Northern Territory
|
| ||||||||||||||||||||||||||||||||||||||||||||||||||||||||||||||||||
See also
References
- ↑ "Federal Election Results 1949-1993" (PDF). Parliament of Australia. Retrieved 13 June 2018.
| House of Representatives | |||
|---|---|---|---|
| Senate | |||
| By-elections | |||