| |||||||||||||||||||||||||||||||||||||||||||||||||||||||
All 151 seats in the Australian House of Representatives 76 seats needed for a majority | |||||||||||||||||||||||||||||||||||||||||||||||||||||||
| Turnout | 91.9% | ||||||||||||||||||||||||||||||||||||||||||||||||||||||
|---|---|---|---|---|---|---|---|---|---|---|---|---|---|---|---|---|---|---|---|---|---|---|---|---|---|---|---|---|---|---|---|---|---|---|---|---|---|---|---|---|---|---|---|---|---|---|---|---|---|---|---|---|---|---|---|
This lists parties that won seats. See the complete results below.
| |||||||||||||||||||||||||||||||||||||||||||||||||||||||

2019 Australian federal election |
|---|
|
| National results |
| State and territory results |
The state-by-state results in the Australian House of Representatives at the 2019 federal election were: Coalition 77, Labor 68, Australian Greens 1, Centre Alliance 1, Katter's Australian Party 1, and Independents 3.[1][2]
Australia
| Party | Votes | % | Swing (pp) | Seats | Change (seats) | |||
|---|---|---|---|---|---|---|---|---|
| Liberal/National Coalition | ||||||||
| Liberal Party of Australia | 3,989,404 | 27.99 | −0.68 | 44 | ||||
| Liberal National Party (Qld) | 1,236,401 | 8.67 | +0.15 | 23 | ||||
| National Party of Australia | 642,233 | 4.51 | −0.10 | 10 | ||||
| Country Liberal Party (NT) | 38,837 | 0.27 | +0.03 | 0 | ||||
| Coalition total | 5,906,875 | 41.44 | −0.60 | 77 | ||||
| Australian Labor Party | 4,752,160 | 33.34 | −1.39 | 68 | ||||
| Australian Greens | 1,482,923 | 10.40 | +0.17 | 1 | ||||
| Katter's Australian Party | 69,736 | 0.49 | −0.05 | 1 | ||||
| Centre Alliance | 46,931 | 0.33 | −1.52 | 1 | ||||
| Independent | 479,836 | 3.37 | +0.56 | 3 [lower-alpha 1] | ||||
| Total | 14,253,393 | 100.00 | – | 151 | ||||
| Two-party-preferred vote | ||||||||
| Liberal/National Coalition | 7,344,813 | 51.53 | +1.17 | |||||
| Labor | 6,908,580 | 48.47 | −1.17 | |||||
| Invalid/blank votes | 835,223 | 5.54 | +0.49 | |||||
| Registered voters[3]/turnout | 16,419,543 | 91.89 | ||||||
| Source: AEC Tally Room | ||||||||

States
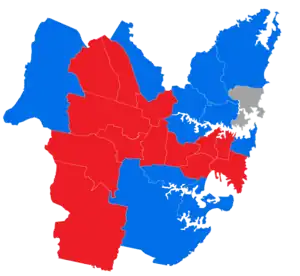
New South Wales
| ||||||||||||||||||||||||||||||||||
All 47 New South Wales seats in the Australian House of Representatives and 6 seats in the Australian Senate | ||||||||||||||||||||||||||||||||||
|---|---|---|---|---|---|---|---|---|---|---|---|---|---|---|---|---|---|---|---|---|---|---|---|---|---|---|---|---|---|---|---|---|---|---|
| ||||||||||||||||||||||||||||||||||

| ||||||||||||||||||||||||||||||||||

Victoria
| |||||||||||||||||||||||||||||||||||||||||||||
All 38 Victorian seats in t he Australian House of Representatives and 6 seats in the Australian Senate | |||||||||||||||||||||||||||||||||||||||||||||
|---|---|---|---|---|---|---|---|---|---|---|---|---|---|---|---|---|---|---|---|---|---|---|---|---|---|---|---|---|---|---|---|---|---|---|---|---|---|---|---|---|---|---|---|---|---|
| |||||||||||||||||||||||||||||||||||||||||||||
.png.webp)
.png.webp)
.png.webp)
| |||||||||||||||||||||||||||||||||||||||||||||
.jpg.webp)
| Party | Votes | % | Swing | Seats | Change | ||
|---|---|---|---|---|---|---|---|
| Liberal/National Coalition | |||||||
| Liberal Party of Australia | 1,288,805 | 34.88 | −2.13 | 12 | |||
| National Party of Australia | 136,737 | 3.70 | −1.05 | 3 | |||
| Coalition total | 1,425,542 | 38.58 | -3.18 | 15 | |||
| Australian Labor Party | 1,361,913 | 36.86 | +1.28 | 21 | |||
| Australian Greens | 439,169 | 11.89 | −1.24 | 1 | |||
| United Australia Party | 134,581 | 3.64 | +3.64 | ||||
| Animal Justice Party | 41,333 | 1.12 | −0.77 | ||||
| Pauline Hanson's One Nation | 35,177 | 0.95 | +0.95 | ||||
| Derryn Hinch's Justice Party | 26,803 | 0.73 | +0.33 | ||||
| Victorian Socialists | 12,453 | 0.34 | +0.34 | ||||
| Shooters, Fishers and Farmers Party | 12,384 | 0.34 | +0.30 | ||||
| Fraser Anning's Conservative National Party | 11,504 | 0.31 | +0.31 | ||||
| Democratic Labour Party | 11,397 | 0.31 | +0.31 | ||||
| Rise Up Australia Party | 10,772 | 0.29 | −0.86 | ||||
| Reason Party | 8,895 | 0.24 | +0.24 | ||||
| Sustainable Australia | 6,809 | 0.18 | +0.18 | ||||
| Australia First Party | 4,094 | 0.11 | +0.02 | ||||
| Citizens Electoral Council | 3,267 | 0.09 | +0.03 | ||||
| The Great Australian Party | 2,457 | 0.07 | +0.07 | ||||
| Socialist Equality Party | 823 | 0.02 | +0.01 | ||||
| Science Party | 497 | 0.01 | +0.01 | ||||
| Independent | 144,043 | 3.90 | +1.18 | 1 | |||
| Non Affiliated | 1,119 | 0.03 | +0.03 | ||||
| Total | 3,695,032 | 38 | |||||
| Two-party-preferred vote | |||||||
| Labor | 1,963,410 | 53.14 | +1.31 | ||||
| Liberal/National Coalition | 1,731,622 | 46.86 | −1.31 | ||||
| Invalid/blank votes | 180,426 | 4.66 | −0.11 | ||||
| Registered voters/turnout | 4,184,076 | 92.62 | +1.48 | ||||
| Source: AEC Tally Room | |||||||
Queensland
| |||||||||||||||||||||||||||||||||||||||||||||||||||||
All 30 Queensland seats in the House of Representatives and 6 seats in the Australian Senate | |||||||||||||||||||||||||||||||||||||||||||||||||||||
|---|---|---|---|---|---|---|---|---|---|---|---|---|---|---|---|---|---|---|---|---|---|---|---|---|---|---|---|---|---|---|---|---|---|---|---|---|---|---|---|---|---|---|---|---|---|---|---|---|---|---|---|---|---|
| |||||||||||||||||||||||||||||||||||||||||||||||||||||
 Results by electorate. | |||||||||||||||||||||||||||||||||||||||||||||||||||||

| Party | Votes | % | Swing | Seats | Change | |
|---|---|---|---|---|---|---|
| Liberal National Party | 1,236,401 | 43.70 | +0.51 | 23 | ||
| Australian Labor Party | 754,792 | 26.68 | −4.23 | 6 | ||
| Australian Greens | 292,059 | 10.32 | +1.49 | |||
| Pauline Hanson's One Nation | 250,779 | 8.86 | +3.34 | |||
| United Australia Party | 99,329 | 3.51 | +3.51 | |||
| Katter's Australian Party | 69,736 | 2.47 | −0.26 | 1 | ||
| Fraser Anning's Conservative National Party | 49,581 | 1.75 | +1.75 | |||
| Liberal Democratic Party | 12,835 | 0.45 | −0.51 | |||
| Animal Justice Party | 12,579 | 0.44 | +0.44 | |||
| Democratic Labour Party | 6,890 | 0.24 | +0.18 | |||
| Love Australia or Leave | 1,564 | 0.06 | +0.06 | |||
| Socialist Alliance | 1,457 | 0.05 | +0.05 | |||
| Sustainable Australia | 1,410 | 0.05 | +0.05 | |||
| Australia First Party | 1,069 | 0.04 | +0.04 | |||
| Australian Progressives | 965 | 0.03 | +0.03 | |||
| Socialist Equality Party | 654 | 0.02 | +0.02 | |||
| Independent | 35,894 | 1.27 | −0.62 | |||
| Non Affiliated | 1,024 | 0.04 | +0.01 | |||
| Total | 2,829,018 | 30 | ||||
| Two-party-preferred vote | ||||||
| Liberal National | 1,653,261 | 58.44 | +4.34 | |||
| Labor | 1,175,757 | 41.56 | −4.34 | |||
| Invalid/blank votes | 147,290 | 4.95 | +0.25 | – | – | |
| Registered voters/turnout | 3,262,898 | 91.22 | +0.05 | – | – | |
| Source: AEC Tally Room | ||||||
Western Australia
| ||||||||||||||||||||||||||||||||||
All 16 Western Australian seats in the Australian House of Representatives and 6 seats in the Australian Senate | ||||||||||||||||||||||||||||||||||
|---|---|---|---|---|---|---|---|---|---|---|---|---|---|---|---|---|---|---|---|---|---|---|---|---|---|---|---|---|---|---|---|---|---|---|
| ||||||||||||||||||||||||||||||||||
| Party | Votes | % | Swing | Seats | Change | ||
|---|---|---|---|---|---|---|---|
| Liberal/National Coalition | |||||||
| Liberal Party of Australia | 613,915 | 43.79 | −1.91 | 11 | |||
| National Party of Australia | 20,015 | 1.43 | −1.57 | 0 | |||
| Coalition total | 633,930 | 45.22 | -3.48 | 11 | |||
| Australian Labor Party | 417,727 | 29.80 | −2.65 | 5 | |||
| Australian Greens | 162,876 | 11.62 | −0.44 | ||||
| Pauline Hanson's One Nation | 74,478 | 5.31 | +5.31 | ||||
| United Australia Party | 28,488 | 2.03 | +2.03 | ||||
| Western Australia Party | 25,298 | 1.80 | +1.80 | ||||
| Australian Christians | 23,802 | 1.70 | −0.86 | ||||
| Shooters, Fishers and Farmers Party | 10,966 | 0.78 | +0.33 | ||||
| Fraser Anning's Conservative National Party | 3,575 | 0.26 | +0.26 | ||||
| Science Party | 1,329 | 0.09 | +0.09 | ||||
| Animal Justice Party | 1,304 | 0.09 | +0.09 | ||||
| Socialist Alliance | 990 | 0.07 | −0.03 | ||||
| The Great Australian Party | 883 | 0.06 | +0.06 | ||||
| VOTEFLUX | 602 | 0.04 | +0.04 | ||||
| Australia First Party | 251 | 0.02 | +0.02 | ||||
| Independent | 15,375 | 1.10 | −0.20 | ||||
| Total | 1,401,874 | 16 | |||||
| Two-party-preferred vote | |||||||
| Liberal/National Coalition | 778,781 | 55.55 | +0.89 | 11 | |||
| Labor | 623,093 | 44.45 | −0.89 | 5 | |||
| Invalid/blank votes | 80,575 | 5.44 | +1.45 | ||||
| Registered voters/turnout | 1,646,262 | 90.05 | +1.67 | ||||
| Source: AEC Tally Room | |||||||
South Australia
| |||||||||||||||||||||||||||||||||||||||||||||
All 10 South Australian seats in the Australian House of Representatives and 6 seats in the Australian Senate | |||||||||||||||||||||||||||||||||||||||||||||
|---|---|---|---|---|---|---|---|---|---|---|---|---|---|---|---|---|---|---|---|---|---|---|---|---|---|---|---|---|---|---|---|---|---|---|---|---|---|---|---|---|---|---|---|---|---|
| |||||||||||||||||||||||||||||||||||||||||||||

| Party | Votes | % | Swing | Seats | Change | ||
|---|---|---|---|---|---|---|---|
| Liberal/National Coalition | |||||||
| Liberal Party of Australia | 435,217 | 40.57 | +5.48 | 4 | |||
| National Party of Australia | 2,796 | 0.26 | +0.26 | ||||
| Coalition total | 438,013 | 40.83 | +5.74 | 4 | |||
| Australian Labor Party | 379,495 | 35.38 | +3.83 | 5 | |||
| Australian Greens | 103,036 | 9.61 | +3.40 | ||||
| Centre Alliance | 46,931 | 4.38 | −16.88 | 1 | |||
| United Australia Party | 46,007 | 4.29 | +4.29 | ||||
| Animal Justice Party | 29,811 | 2.78 | +1.93 | ||||
| Pauline Hanson's One Nation | 8,990 | 0.84 | +0.84 | ||||
| Fraser Anning's Conservative National Party | 2,920 | 0.27 | +0.27 | ||||
| Australian Democrats | 2,039 | 0.19 | +0.19 | ||||
| Child Protection Party | 1,219 | 0.11 | +0.11 | ||||
| Rise Up Australia Party | 603 | 0.06 | +0.06 | ||||
| Australian Progressives | 565 | 0.05 | +0.05 | ||||
| Independent | 13,019 | 1.21 | +0.47 | ||||
| Total | 1,072,648 | 10 | |||||
| Two-party-preferred vote | |||||||
| Labor | 543,898 | 50.71 | −1.56 | 5 | |||
| Liberal/National Coalition | 528,750 | 49.29 | +1.56 | 4 | |||
| Invalid/blank votes | 54,202 | 4.81 | +0.63 | ||||
| Registered voters/turnout | 1,210,817 | 93.07 | +1.26 | ||||
| Source: AEC Tally Room | |||||||
Tasmania
| ||||||||||||||||||||||||||||||||||
All 5 Tasmanian seats in the Australian House of Representatives and 6 seats in the Australian Senate | ||||||||||||||||||||||||||||||||||
|---|---|---|---|---|---|---|---|---|---|---|---|---|---|---|---|---|---|---|---|---|---|---|---|---|---|---|---|---|---|---|---|---|---|---|
| ||||||||||||||||||||||||||||||||||
 Results by electorate | ||||||||||||||||||||||||||||||||||
| Party | Votes | % | Swing | Seats | Change | ||
|---|---|---|---|---|---|---|---|
| Liberal/National Coalition | |||||||
| Liberal Party of Australia | 106,596 | 30.63 | −4.81 | 2 | |||
| National Party of Australia | 13,819 | 3.97 | +3.97 | 0 | |||
| Coalition total | 120,415 | 34.60 | -0.84 | 2 | |||
| Australian Labor Party | 116,955 | 33.61 | −4.29 | 2 | |||
| Australian Greens | 35,229 | 10.12 | −0.10 | ||||
| United Australia Party | 16,868 | 4.85 | +4.85 | ||||
| Pauline Hanson's One Nation | 9,699 | 2.79 | +2.79 | ||||
| Fraser Anning's Conservative National Party | 1,969 | 0.57 | +0.57 | ||||
| Animal Justice Party | 1,667 | 0.48 | +0.48 | ||||
| Independent | 45,190 | 12.99 | +4.24 | 1 | |||
| Total | 347,992 | 5 | |||||
| Two-party-preferred vote | |||||||
| Labor | 194,746 | 55.96 | −1.40 | ||||
| Liberal/National Coalition | 153,246 | 44.04 | +1.40 | ||||
| Invalid/blank votes | 15,970 | 4.39 | +0.41 | – | – | ||
| Registered voters/turnout | 385,816 | 94.34 | +0.75 | – | – | ||
| Source: AEC Tally Room | |||||||
Territories
Australian Capital Territory
| ||||||||||||||||||||||||||||||||||
All 3 Australian Capital Territory seats in the Australian House of Representatives and all 2 seats in the Australian Senate | ||||||||||||||||||||||||||||||||||
|---|---|---|---|---|---|---|---|---|---|---|---|---|---|---|---|---|---|---|---|---|---|---|---|---|---|---|---|---|---|---|---|---|---|---|
| ||||||||||||||||||||||||||||||||||
 Results by electorate. | ||||||||||||||||||||||||||||||||||
| Party | Votes | % | Swing | Seats | Change | |
|---|---|---|---|---|---|---|
| Australian Labor Party | 109,300 | 41.09 | −3.18 | 3 | ||
| Liberal Party of Australia | 83,311 | 31.32 | −3.24 | 0 | ||
| Australian Greens | 44,804 | 16.85 | +1.76 | |||
| United Australia Party | 7,117 | 2.68 | +2.68 | |||
| Australian Progressives | 6,229 | 2.34 | +2.34 | |||
| Liberal Democratic Party | 2,540 | 0.95 | +0.95 | |||
| The Great Australian Party | 929 | 0.35 | +0.35 | |||
| Independent | 11,745 | 4.42 | +2.56 | |||
| Total | 265,975 | 3 | ||||
| Two-party-preferred vote | ||||||
| Labor | 163,878 | 61.61 | +0.48 | |||
| Liberal | 102,097 | 38.39 | −0.48 | |||
| Invalid/blank votes | 9,616 | 3.49 | +0.73 | |||
| Registered voters/turnout | 295,847 | 93.15 | +0.99 | |||
| Source: AEC Tally Room | ||||||
Northern Territory
| ||||||||||||||||||||||||||||||||||
All 2 Northern Territory seats in the Australian House of Representatives and all 2 seats in the Australian Senate | ||||||||||||||||||||||||||||||||||
|---|---|---|---|---|---|---|---|---|---|---|---|---|---|---|---|---|---|---|---|---|---|---|---|---|---|---|---|---|---|---|---|---|---|---|
| ||||||||||||||||||||||||||||||||||
 Results by electorate. | ||||||||||||||||||||||||||||||||||
| Party | Votes | % | Swing | Seats | Change | |
|---|---|---|---|---|---|---|
| Australian Labor Party | 43,755 | 42.27 | +1.88 | 2 | ||
| Country Liberal Party | 38,837 | 37.52 | +4.27 | 0 | ||
| Australian Greens | 10,512 | 10.15 | +1.06 | |||
| United Australia Party | 2,950 | 2.85 | +2.85 | |||
| Rise Up Australia Party | 2,657 | 2.57 | +0.02 | |||
| Independent | 4,807 | 4.64 | −1.24 | |||
| Total | 103,518 | 2 | ||||
| Two-party-preferred vote | ||||||
| Australian Labor Party | 56,103 | 54.20 | −2.86 | 2 | ||
| Country Liberal Party | 47,415 | 45.80 | +2.86 | 0 | ||
| Invalid/blank votes | 5,093 | 4.69 | −2.66 | |||
| Registered voters/turnout | 139,359 | 77.94 | −1.07 | |||
| Source: AEC Tally Room | ||||||
Two party preferred preference flow
| Party | Liberal/National Coalition | Labor Party | ||||||
|---|---|---|---|---|---|---|---|---|
| Votes | % | ± | Votes | % | ± | |||
| Greens | 263,830 | 17.79% | –0.27 | 1,219,093 | 82.21% | +0.27 | ||
| One Nation | 286,049 | 65.22% | +14.75 | 152,538 | 34.78% | –14.75 | ||
| United Australia | 318,413 | 65.14% | +28.0 | 170,404 | 34.86% | –28.0 | ||
| Liberal Democrats | 26,776 | 77.24% | +7.13 | 7,890 | 22.76% | –7.13 | ||
| Christian Democrats | 72,575 | 74.43% | +1.23 | 24,938 | 25.57% | –1.23 | ||
| Conservative Nationals | 55,437 | 71.81% | – | 21,766 | 28.19% | – | ||
| Democratic Labour | 7,271 | 39.76% | +4.01 | 11,016 | 60.24% | –4.01 | ||
| Rise Up Australia | 8,481 | 60.44% | +7.47 | 5,551 | 39.56% | –7.47 | ||
| Australia First | 3,830 | 56.44% | +10.60 | 2,956 | 43.56% | –10.60 | ||
| Love Australia or Leave | 852 | 54.48% | – | 712 | 45.52% | – | ||
| Animal Justice Party | 44,824 | 38.42% | +1.17 | 71,851 | 61.58% | –1.17 | ||
| Federation | ||||||||
| Katter's Australian | 46,754 | 67.04% | +14.00 | 22,982 | 32.96% | –14.00 | ||
| Centre Alliance | 15,438 | 32.90% | 31,493 | 67.10% | ||||
| Western Australia | 12,390 | 48.98% | – | 12,908 | 51.02% | – | ||
| The Great Australian | 2,842 | 53.07% | – | 2,513 | 46.93% | – | ||
| Victorian Socialists | 1,546 | 12.41% | – | 10,907 | 87.59% | – | ||
| Informed Medical Options | 429 | 36.39% | – | 750 | 63.61% | – | ||
| Australian Christians | 19,229 | 80.79% | +8.52 | 4,573 | 19.21% | –8.52 | ||
| Shooters, Fishers and Farmers | 24,498 | 59.06% | +13.25 | 16,981 | 40.94% | –13.25 | ||
| Fusion | 4,105 | 32.54% | – | 8,512 | 67.46% | – | ||
| Socialist Alliance | 495 | 20.23% | –5.72 | 1,952 | 79.77% | +5.72 | ||
| Justice | 12,393 | 46.24% | –2.77 | 14,410 | 53.76% | +2.77 | ||
| Australian Citizens | 863 | 26.42% | –26.04 | 2,404 | 73.58% | +26.04 | ||
| Sustainable Australia | 16,389 | 46.01% | –5.48 | 19,229 | 53.99% | +5.48 | ||
| Reason | 2,776 | 31.21% | +0.00 | 6,119 | 68.79% | +0.00 | ||
| Australian Progressives | 2,543 | 32.77% | – | 5,216 | 67.23% | – | ||
| Australian Democrats | 631 | 30.95% | – | 1,408 | 69.05% | – | ||
| Independents | 194,826 | 40.60% | +0.00 | 285,010 | 59.40% | +0.00 | ||
| Total | 14,659,042 | 100.00 | 151 | |||||
| Two-party-preferred vote | ||||||||
| Liberal/National Coalition | 7,344,813 | 51.53% | +1.17 | |||||
| Labor | 7,642,161 | 48.47% | –1.17 | |||||
| Invalid/blank votes | 802,376 | 5.19 | –0.35 | – | – | – | ||
| Turnout | 15,461,418 | 89.82 | –2.07 | – | – | – | ||
| Registered voters | 17,213,433 | – | – | – | – | – | ||
| Source: AEC for both votes | ||||||||
Notes
- ↑ The independent members were Andrew Wilkie (Clark, Tas), Helen Haines (Indi, Vic) and Zali Steggall (Warringah, NSW).
References
- 1 2 Muller, Damon (29 June 2020). "Federal Election 2019" (PDF). Research Paper 2019–20. Parliamentary Library. ISSN 2203-5249.
- ↑ "First preferences by party". AEC Tally Room. Australian Electoral Commission. Retrieved 31 July 2019.
- ↑ "Enrolment by state". Archived from the original on 20 October 2019. Retrieved 11 July 2019.
- ↑ "First preferences by party". Australian Electoral Commission. Retrieved 28 May 2022.
- ↑ "House Party Representation Leading". aec.gov.au. Retrieved 24 June 2022.
External links
- Australian Electoral Commission: 2019 Tally Room
- ABC Elections: 2019 Federal Election Results
- How did we vote? - A detailed breakdown of Australia's election
| ||
| Campaign |  | |
| Results | ||
| House of Representatives | |||
|---|---|---|---|
| Senate | |||
| By-elections | |||
This article is issued from Wikipedia. The text is licensed under Creative Commons - Attribution - Sharealike. Additional terms may apply for the media files.