| ||||||||||||||||||||||||||||||||||||||||
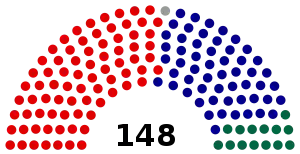
All 148 seats in the House of Representatives 75 seats were needed for a majority in the House 40 (of the 76) seats in the Senate | ||||||||||||||||||||||||||||||||||||||||
|---|---|---|---|---|---|---|---|---|---|---|---|---|---|---|---|---|---|---|---|---|---|---|---|---|---|---|---|---|---|---|---|---|---|---|---|---|---|---|---|---|
| Registered | 10,728,435 | |||||||||||||||||||||||||||||||||||||||
| Turnout | 10,225,800 (95.31%) ( | |||||||||||||||||||||||||||||||||||||||
| ||||||||||||||||||||||||||||||||||||||||
 Results by division for the House of Representatives, shaded by winning party's margin of victory. | ||||||||||||||||||||||||||||||||||||||||
| ||||||||||||||||||||||||||||||||||||||||
1990 Australian federal election |
|---|
| National results |
| State and territory results |
|
|
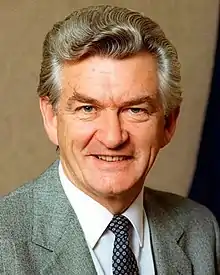
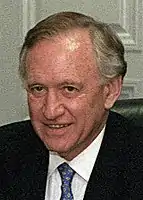
The following tables show results for the Australian House of Representatives at the 1990 federal election held on 24 March 1990.[1]
Australia
| Party | Votes | % | Swing | Seats | Change | ||||
|---|---|---|---|---|---|---|---|---|---|
| Liberal | 3,440,902 | 34.76 | +0.44 | 55 | |||||
| National | 833,557 | 8.42 | –3.10 | 14 | |||||
| Country Liberal | 27,668 | 0.28 | +0.05 | 0 | |||||
| Liberal–National coalition | 4,302,127 | 43.46 | –2.44 | 69 | |||||
| Labor | 3,904,138 | 39.44 | –6.46 | 78 | |||||
| Democrats | 1,114,216 | 11.26 | +5.26 | ||||||
| Greens (state-based)[lower-alpha 1] | 137,351 | 1.37 | |||||||
| Independents [lower-alpha 2] | 257,139 | 2.60 | +0.94 | 1 | |||||
| Total | 9,899,674 | 148 | |||||||
| Two-party-preferred vote | |||||||||
| Labor | 4,930,837 | 49.90 | −0.93 | 78 | |||||
| Liberal–National coalition | 4,950,072 | 50.10 | +0.93 | 69 | |||||
| Invalid/blank votes | 326,126 | 3.19 | –1.75 | ||||||
| Turnout | 10,225,800 | 95.32 | |||||||
| Registered voters | 10,728,131 | ||||||||
| Source: Federal Elections 1990 | |||||||||
States
New South Wales
| ||||||||||||||||||||||||||||||||||
All 51 New South Wales seats in the Australian House of Representatives and 6 seats in the Australian Senate | ||||||||||||||||||||||||||||||||||
|---|---|---|---|---|---|---|---|---|---|---|---|---|---|---|---|---|---|---|---|---|---|---|---|---|---|---|---|---|---|---|---|---|---|---|
| ||||||||||||||||||||||||||||||||||
| Party | Votes | % | Swing | Seats | Change | ||
|---|---|---|---|---|---|---|---|
| Liberal | 975,083 | 32.76 | −4.19 | 12 | |||
| National | 377,687 | 10.53 | −0.52 | 8 | |||
| Liberal/National Coalition | 1,352,770 | 40.32 | −4.72 | 20 | |||
| Labor | 1,380,780 | 41.16 | +4.01 | 30 | |||
| Democrats | 342,540 | 10.21 | +6.34 | ||||
| Independents [lower-alpha 2] | 166,832 | 4.97 | +1.55 | 1 | |||
| Green Alliance [lower-alpha 3] | 45,819 | 1.37 | |||||
| Call to Australia | 21,646 | 0.65 | |||||
| Independent EFF | 9,375 | 0.28 | |||||
| Rex Connor Labor | 8,277 | 0.25 | |||||
| New Australia | 6,376 | 0.19 | |||||
| Democratic Socialist | 5,809 | 0.17 | |||||
| Grey Power | 5,034 | 0.15 | |||||
| Environment Inds | 4,866 | 0.15 | |||||
| Nuclear Disarmament | 3,210 | 0.10 | +0.07 | ||||
| Socialist | 1,337 | 0.04 | |||||
| Total | 3,354,671 | 51 | |||||
| Two-party-preferred vote | |||||||
| Labor | 1,706,398 | 51.94 | +1.65 | ||||
| Liberal/National Coalition | 1,578,738 | 48.06 | –1.65 | ||||
| Invalid/blank votes | 108,134 | 3.1 | –1.5 | ||||
| Turnout | 3,462,805 | 95.4 | |||||
| Registered voters | 3,630,841 | ||||||
| Source: Federal Elections 1990 | |||||||
Victoria
| ||||||||||||||||||||||||||||||||||
All 38 Victorian seats in the Australian House of Representatives and 6 seats in the Australian Senate | ||||||||||||||||||||||||||||||||||
|---|---|---|---|---|---|---|---|---|---|---|---|---|---|---|---|---|---|---|---|---|---|---|---|---|---|---|---|---|---|---|---|---|---|---|
| ||||||||||||||||||||||||||||||||||
| Party | Votes | % | Swing | Seats | Change | ||
|---|---|---|---|---|---|---|---|
| Liberal | 1,018,740 | 39.7 | +1.7 | 21 | |||
| National | 154,069 | 6.0 | −0.3 | 3 | |||
| Liberal/National Coalition | 1,172,809 | 45.7 | +1.4 | 24 | |||
| Labor | 951,674 | 37.1 | −9.8 | 14 | |||
| Democrats | 319,149 | 12.43 | +5.7 | ||||
| Independents | 55,357 | 2.16 | −4.3 | ||||
| Call to Australia | 52,554 | 2.05 | |||||
| Democratic Socialist | 6,836 | 0.27 | |||||
| Citizens Electoral Council | 3,524 | 0.14 | |||||
| Democratic Labor | 2,564 | 0.10 | −0.04 | ||||
| Socialist | 918 | 0.04 | |||||
| Pensioner | 910 | 0.04 | |||||
| Against Further Immigration | 835 | 0.03 | |||||
| Total | 2,567,139 | 38 | |||||
| Two-party-preferred vote | |||||||
| Liberal/National Coalition | 1,347,048 | 52.54 | +5.1 | 24 | |||
| Labor | 1,216,633 | 47.46 | −5.1 | 14 | |||
| Invalid/blank votes | 94,334 | 3.54 | −1.7 | ||||
| Turnout | 2,661,464 | 95.68 | |||||
| Registered voters | 2,781,547 | ||||||
| Source: Federal Elections 1990 | |||||||
Queensland
| ||||||||||||||||||||||||||||||||||
All 24 Queensland seats in the Australian House of Representatives and 6 seats in the Australian Senate | ||||||||||||||||||||||||||||||||||
|---|---|---|---|---|---|---|---|---|---|---|---|---|---|---|---|---|---|---|---|---|---|---|---|---|---|---|---|---|---|---|---|---|---|---|
| ||||||||||||||||||||||||||||||||||
| Party | Votes | % | Swing | Seats | Change | ||
|---|---|---|---|---|---|---|---|
| Liberal | 476,560 | 28.51 | 7.49 | 6 | |||
| National | 280,120 | 16.76 | –12.09 | 3 | |||
| Liberal/National Coalition | 756,680 | 45.27 | –4.60 | 9 | |||
| Labor | 695,291 | 41.59 | –3.37 | 15 | |||
| Democrats | 193,817 | 11.59 | 6.71 | ||||
| Independent | 11,499 | 0.69 | 0.51 | ||||
| Greens | 10,054 | 0.60 | 0.60 | ||||
| Democratic Socialist | 2,728 | 0.16 | 0.16 | ||||
| Conservative | 1,528 | 0.09 | 0.09 | ||||
| Total | 1,671,597 | 24 | |||||
| Two-party-preferred vote | |||||||
| Labor | 837,508 | 50.19 | +0.87 | 15 | |||
| Liberal/National Coalition | 831,015 | 49.81 | –0.87 | 9 | |||
| Invalid/blank votes | 38,065 | 2.23 | –1.18 | ||||
| Turnout | 1,709,662 | 94.71 | |||||
| Registered voters | 1,805,141 | ||||||
| Source: Federal Elections 1990 | |||||||
Western Australia
| ||||||||||||||||||||||||||||||||||
All 14 Western Australia seats in the Australian House of Representatives and 6 seats in the Australian Senate | ||||||||||||||||||||||||||||||||||
|---|---|---|---|---|---|---|---|---|---|---|---|---|---|---|---|---|---|---|---|---|---|---|---|---|---|---|---|---|---|---|---|---|---|---|
| ||||||||||||||||||||||||||||||||||
| Party | Votes | % | Swing | Seats | Change | ||
|---|---|---|---|---|---|---|---|
| Liberal | 392,870 | 43.91 | 2.12 | 6 | |||
| National | 21,681 | 2.42 | -4.48 | ||||
| Liberal/National Coalition | 414,551 | 46.33 | -2.36 | 4 | |||
| Labor | 316,186 | 35.34 | -12.14 | 9 | |||
| Democrats | 75,197 | 8.40 | +4.97 | ||||
| Greens | 67,164 | 7.51 | |||||
| Grey Power | 12,043 | 1.35 | |||||
| Independents | 5,756 | 0.64 | +0.25 | ||||
| Democratic Socialist | 3,336 | 0.37 | |||||
| Pensioner | 260 | 0.03 | |||||
| Conservative | 206 | 0.02 | |||||
| Total | 894,699 | 13 | |||||
| Two-party-preferred vote | |||||||
| Labor | 420,816 | 47.13 | -3.78 | 8 | |||
| Liberal/National Coalition | 472,092 | 52.87 | 3.78 | 6 | |||
| Invalid/blank votes | 34,418 | 3.70 | -2.86 | ||||
| Turnout | 929,117 | 94.53 | |||||
| Registered voters | 982,901 | ||||||
| Source: Federal Elections 1990 | |||||||
South Australia
| ||||||||||||||||||||||||||||||||||
All 13 South Australian seats in the Australian House of Representatives and 6 seats in the Australian Senate | ||||||||||||||||||||||||||||||||||
|---|---|---|---|---|---|---|---|---|---|---|---|---|---|---|---|---|---|---|---|---|---|---|---|---|---|---|---|---|---|---|---|---|---|---|
| ||||||||||||||||||||||||||||||||||
| Party | Votes | % | Swing | Seats | Change | ||
|---|---|---|---|---|---|---|---|
| Liberal | 381,172 | 42.65 | +0.14 | 6 | |||
| Labor | 339,218 | 37.95 | -6.60 | 7 | |||
| Democrats | 135,546 | 15.17 | +7.38 | ||||
| Call to Australia | 22,297 | 2.49 | |||||
| Independents | 8,104 | 0.91 | 0.02 | ||||
| Grey Power | 3,907 | 0.44 | |||||
| Greens | 1,878 | 0.21 | |||||
| Democratic Socialist | 1,632 | 0.18 | |||||
| Total | 893,754 | 13 | |||||
| Two-party-preferred vote | |||||||
| Labor | 441,659 | 49.5 | -0.7 | 7 | |||
| Liberal/National Coalition | 450.503 | 50.5 | +0.7 | 6 | |||
| Invalid/blank votes | 34,143 | 3.68 | -3.16 | ||||
| Turnout | 927,897 | 96.01 | |||||
| Registered voters | 966,431 | ||||||
| Source: Federal Elections 1990 | |||||||
Tasmania
| ||||||||||||||||||||||||||||||||||
All 5 Tasmanian seats in the Australian House of Representatives and 6 seats in the Australian Senate | ||||||||||||||||||||||||||||||||||
|---|---|---|---|---|---|---|---|---|---|---|---|---|---|---|---|---|---|---|---|---|---|---|---|---|---|---|---|---|---|---|---|---|---|---|
| ||||||||||||||||||||||||||||||||||
| Party | Votes | % | Swing | Seats | Change | |
|---|---|---|---|---|---|---|
| Liberal | 140,722 | 48.61 | −2.44 | 4 | ||
| Labor | 115,053 | 39.74 | −3.25 | 1 | ||
| Democrats | 24,876 | 8.59 | +2.63 | |||
| United Tasmania | 6,367 | 2.20 | ||||
| Independent | 2,159 | 0.75 | ||||
| Democratic Socialist | 327 | 0.11 | ||||
| Total | 289,504 | 5 | ||||
| Two-party-preferred vote | ||||||
| Liberal | 138,556 | 52.10 | −1.00 | 4 | ||
| Labor | 150,709 | 47.90 | +1.00 | 1 | ||
| Invalid/blank votes | 9,774 | 3.27 | −1.68 | |||
| Turnout | 299,278 | 96.5 | ||||
| Registered voters | 300,763 | |||||
| Source: Federal Elections 1990 | ||||||
Territories
Australian Capital Territory
| ||||||||||||||||||||||||||||||||||
Both Australian Capital Territory seats in the Australian House of Representatives and both seats in the Australian Senate | ||||||||||||||||||||||||||||||||||
|---|---|---|---|---|---|---|---|---|---|---|---|---|---|---|---|---|---|---|---|---|---|---|---|---|---|---|---|---|---|---|---|---|---|---|
| ||||||||||||||||||||||||||||||||||
| Party | Votes | % | Swing | Seats | Change | |
|---|---|---|---|---|---|---|
| Labor | 71,830 | 44.88 | -9.04 | 2 | ||
| Liberal | 55,755 | 34.83 | 4.55 | |||
| Democrats | 23,091 | 14.43 | 7.59 | |||
| Green Democratic | 6,069 | 3.79 | 0.00 | |||
| Nuclear Disarmament | 2,368 | 1.48 | -3.19 | |||
| Independent | 949 | 0.59 | -0.96 | |||
| Total | 160,062 | 2 | ||||
| Two-party-preferred vote | ||||||
| Labor | 93,498 | 58.54 | -4.71 | 2 | ||
| Liberal | 66,206 | 41.46 | 4.71 | 0 | ||
| Invalid/blank votes | 4,871 | 2.95 | -0.53 | |||
| Turnout | 164,933 | 95.78 | ||||
| Registered voters | 172,200 | |||||
| Source: Psephos Adam Carr's Election Archive 1990 | ||||||
Northern Territory
| ||||||||||||||||||||||||||||||||||
The one Northern Territory seat in the Australian House of Representatives and both seats in the Australian Senate | ||||||||||||||||||||||||||||||||||
|---|---|---|---|---|---|---|---|---|---|---|---|---|---|---|---|---|---|---|---|---|---|---|---|---|---|---|---|---|---|---|---|---|---|---|
| ||||||||||||||||||||||||||||||||||
| Party | Candidate | Votes | % | ±% | |
|---|---|---|---|---|---|
| Labor | Warren Snowdon | 34,106 | 50.0 | +3.1 | |
| Country Liberal | Helen Galton | 27,668 | 40.5 | +4.5 | |
| Independent | Don Beaton | 1,900 | 2.8 | +2.8 | |
| Independent | Bob Liddle | 1,427 | 2.1 | +2.1 | |
| Independent | Tig Donnellan | 1,380 | 2.0 | +2.0 | |
| Independent | Strider | 975 | 1.4 | +1.4 | |
| Independent | Ron Sterry | 801 | 1.2 | +1.2 | |
| Total formal votes | 68,257 | 96.6 | |||
| Informal votes | 2,387 | 3.4 | |||
| Turnout | 70,644 | 89.4 | |||
| Two-party-preferred result | |||||
| Labor | Warren Snowdon | 37,498 | 55.0 | +2.8 | |
| Country Liberal | Helen Galton | 30,650 | 45.0 | -2.8 | |
| Labor hold | Swing | +2.8 | |||
See also
Notes
- ↑ There was no federal Australian Greens party at this election. The Greens total includes Greens Western Australia (67,164), NSW Green Alliance [lower-alpha 3] (45,819), Queensland Greens (10,054), United Tasmania Group (6,367), Greens South Australia (1,878) and ACT Green Democratic Alliance (6,069).
- 1 2 The independent member was Ted Mack (NSW).
- ↑ At this election the Greens in New South Wales were a loose alliance largely organised by local groups, with 18 candidates running under a variety of names: Australian Gruen Party (Fowler, Macarthur, Mackellar, Macquarie, Prospect, St George, Throsby and Werriwa), the Greens (Phillip and Wentworth), Illawarra Greens (Cunningham and Hughes), Sydney Greens, South Sydney Greens (Kingsford Smith), Central Coast Green Party (Dobell and Robertson), Greens in Lowe and Cowper Greens.
References
- ↑ Newman, G; Kopras, A (20 July 1990). "Federal Elections 1990" (PDF). Background Paper 18 1990. Parliamentary Research Service. ISSN 1034-8107. Retrieved 20 June 2022.
- 1 2 3 4 5 6 7 "1990 House of Representatives". Psephos Adam Carr's Election Archive. Retrieved 10 June 2022.
- ↑ "1990 House of Representatives: Northern Territory". Psephos Adam Carr's Election Archive. Retrieved 22 June 2022.
| House of Representatives | |||
|---|---|---|---|
| Senate | |||
| By-elections | |||
This article is issued from Wikipedia. The text is licensed under Creative Commons - Attribution - Sharealike. Additional terms may apply for the media files.