| ||||||||||||||||||||||||||||||||||||||||||||||||||||||||||||||||
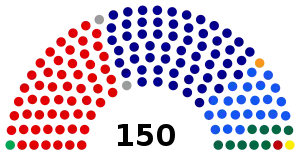
All 150 seats in the Australian House of Representatives 76 seats needed for a majority | ||||||||||||||||||||||||||||||||||||||||||||||||||||||||||||||||
| Turnout | 93.2% | |||||||||||||||||||||||||||||||||||||||||||||||||||||||||||||||
|---|---|---|---|---|---|---|---|---|---|---|---|---|---|---|---|---|---|---|---|---|---|---|---|---|---|---|---|---|---|---|---|---|---|---|---|---|---|---|---|---|---|---|---|---|---|---|---|---|---|---|---|---|---|---|---|---|---|---|---|---|---|---|---|---|
This lists parties that won seats. See the complete results below.
| ||||||||||||||||||||||||||||||||||||||||||||||||||||||||||||||||
2013 Australian federal election |
|---|
| National results |
| State and territory results |
|
|
The following tables show state-by-state results in the Australian House of Representatives at the 2013 federal election, Coalition 90, Labor 55, Australian Greens 1, Palmer United Party 1, Katter's Australian Party 1, with 2 independents.[1]
Australia
.svg.png.webp)
Results by winning party by division for the House of Representatives.

Government (90)
Coalition
Liberal (58)
LNP (22)
National (9)
CLP (1)
Opposition (55)
Labor (55)
Crossbench (5)
Green (1)
Palmer (1)
Katter (1)
Independent (2)
Coalition
Liberal (58)
LNP (22)
National (9)
CLP (1)
Opposition (55)
Labor (55)
Crossbench (5)
Green (1)
Palmer (1)
Katter (1)
Independent (2)
| Party | Votes | % | Swing | Seats | Change | ||
|---|---|---|---|---|---|---|---|
| Labor | 4,311,365 | 33.38 | −4.61 | 55 | |||
| Coalition | 90 | ||||||
| Liberal | 4,134,865 | 32.02 | +1.56 | 58 | |||
| Liberal National | 1,152,217 | 8.92 | −0.20 | 22 | |||
| National | 554,268 | 4.29 | +0.56 | 9 | |||
| Country Liberal (NT) | 41,468 | 0.32 | +0.01 | 1 | |||
| Greens | 1,116,918 | 8.65 | −3.11 | 1 | |||
| Palmer United | 709,035 | 5.49 | +5.49 | 1 | |||
| Family First | 181,820 | 1.41 | −0.84 | ||||
| Katter's Australian | 134,226 | 1.04 | +0.73 | 1 | |||
| Independents | 177,217 | 1.37 | −1.15 | 2 | |||
| Total | 12,914,927 | 150 | |||||
| Two-party-preferred vote | |||||||
| Liberal/National Coalition | 6,908,710 | 53.49 | +3.61 | 90 | |||
| Labor | 6,006,217 | 46.51 | −3.61 | 55 | |||
| Invalid/blank votes | 811,143 | 5.91 | +0.36 | ||||
| Registered voters/turnout | 14,723,385 | 93.23 | |||||
| Source: Federal Election 2013 | |||||||
Preference flows
- Greens − Labor 83.0% (+4.2) to Coalition 17.0% (−4.2)
- Palmer − Coalition 53.7% to Labor 46.3%
- Family First − Coalition 58.3% (−1.5) to Labor 41.7% (+1.5)
- Katter − Coalition 54.0% to Labor 46.0%
- Independent candidates − Labor 57.1% (+13.6) to Coalition 42.9% (−13.6)[3]
New South Wales
| ||||||||||||||||||||||||||||||||||
All 48 New South Wales seats in the Australian House of Representatives and 6 (of the 12) seats in the Australian Senate | ||||||||||||||||||||||||||||||||||
|---|---|---|---|---|---|---|---|---|---|---|---|---|---|---|---|---|---|---|---|---|---|---|---|---|---|---|---|---|---|---|---|---|---|---|
| ||||||||||||||||||||||||||||||||||

| ||||||||||||||||||||||||||||||||||
| Party | Votes | % | Swing | Seats | Change | ||
|---|---|---|---|---|---|---|---|
| Coalition | |||||||
| Liberal | 1,551,436 | 37.35 | +0.68 | 23 | |||
| National | 414,772 | 9.99 | +2.06 | 7 | |||
| Labor | 1,433,842 | 34.52 | −2.76 | 18 | |||
| Greens | 330,050 | 7.95 | –2.29 | ||||
| Palmer United | 174,551 | 4.20 | +4.20 | ||||
| Christian Democrats | 88,576 | 2.13 | +0.77 | ||||
| One Nation | 19,517 | 0.47 | –0.01 | ||||
| Democratic Labour | 16,909 | 0.41 | +0.41 | ||||
| Katter's Australian | 16,534 | 0.40 | +0.40 | ||||
| Bullet Train | 8,174 | 0.20 | +0.20 | ||||
| Australia First | 6,084 | 0.15 | +0.07 | ||||
| Rise Up Australia | 5,449 | 0.13 | +0.13 | ||||
| Citizens Electoral Council | 4,057 | 0.10 | +0.07 | ||||
| Sex Party | 3,292 | 0.08 | +0.00 | ||||
| Stable Population | 2,245 | 0.05 | +0.05 | ||||
| Aus. Independents | 2,092 | 0.05 | +0.05 | ||||
| Non-Custodial Parents | 1,332 | 0.03 | –0.04 | ||||
| Socialist Alliance | 1,229 | 0.03 | –0.06 | ||||
| Future | 693 | 0.02 | +0.02 | ||||
| Secular | 602 | 0.01 | –0.08 | ||||
| Australian Voice | 545 | 0.01 | +0.01 | ||||
| Independents | 71,848 | 1.73 | −2.58 | 0 | |||
| Total | 4,153,829 | 48 | |||||
| Two-party-preferred vote | |||||||
| Liberal/National Coalition | 2,257,654 | 54.35 | +3.19 | 30 | |||
| Labor | 1,896,175 | 45.65 | –3.19 | 18 | |||
Labor to Liberal: Banks, Barton, Eden-Monaro, Lindsay, Reid, Robertson
Labor to National: Page
Independent to Liberal: Dobell (Labor at last election)
Independent to National: Lyne, New England
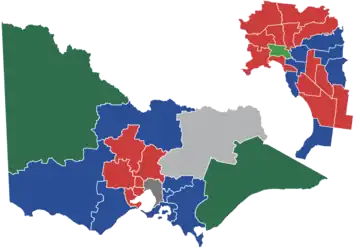
Victoria
| |||||||||||||||||||||||||||||||||||||||||||||
All 37 Victorian seats in the Australian House of Representatives and 6 (of the 12) seats in the Australian Senate | |||||||||||||||||||||||||||||||||||||||||||||
|---|---|---|---|---|---|---|---|---|---|---|---|---|---|---|---|---|---|---|---|---|---|---|---|---|---|---|---|---|---|---|---|---|---|---|---|---|---|---|---|---|---|---|---|---|---|
| |||||||||||||||||||||||||||||||||||||||||||||
.png.webp)
.png.webp)
| |||||||||||||||||||||||||||||||||||||||||||||

Electoral divisions: Victoria
Electoral divisions: Melbourne area
| Party | Votes | % | Swing | Seats | Change | ||
|---|---|---|---|---|---|---|---|
| Coalition | |||||||
| Liberal | 1,320,417 | 40.08 | +3.63 | 14 | |||
| National | 86,045 | 2.61 | –0.58 | 2 | |||
| Labor | 1,146,894 | 34.81 | –8.00 | 19 | |||
| Greens | 355,698 | 10.80 | –1.86 | 1 | |||
| Palmer United | 119,623 | 3.63 | +3.63 | ||||
| Australian Sex Party | 67,460 | 2.05 | +1.86 | ||||
| Family First | 59,288 | 1.80 | –1.34 | ||||
| Rise Up Australia | 18,124 | 0.55 | +0.55 | ||||
| Democratic Labour | 16,714 | 0.51 | +0.51 | ||||
| Australian Christians | 15,886 | 0.48 | +0.48 | ||||
| Katter's Australian | 15,409 | 0.47 | +0.47 | ||||
| Liberal Democrats | 4,716 | 0.14 | –0.11 | ||||
| Country Alliance | 4,708 | 0.14 | +0.14 | ||||
| Animal Justice | 1,878 | 0.06 | +0.06 | ||||
| Bullet Train | 1,772 | 0.05 | +0.05 | ||||
| Socialist Alliance | 1,703 | 0.05 | –0.02 | ||||
| Stable Population | 856 | 0.03 | +0.03 | ||||
| Secular | 776 | 0.02 | –0.14 | ||||
| Citizens Electoral Council | 557 | 0.03 | −0.01 | ||||
| Non-Custodial Parents | 215 | 0.01 | +0.01 | ||||
| Australia First | 212 | 0.01 | +0.00 | ||||
| Senator Online | 209 | 0.01 | +0.01 | ||||
| Aus. Independents | 170 | 0.01 | +0.01 | ||||
| Protectionist | 156 | 0.00 | +0.00 | ||||
| Independents | 53,307 | 1.62 | +0.79 | 1 | |||
| Non Affiliated | 1,886 | 0.06 | +0.04 | ||||
| Total | 3,294,659 | 37 | |||||
| Two-party-preferred vote | |||||||
| Labor | 1,653,977 | 50.20 | −5.11 | 19 | |||
| Liberal/National Coalition | 1,640,682 | 49.80 | +5.11 | 16 | |||
Independents: Cathy McGowan
Labor to Liberal: Corangamite, Deakin, La Trobe
Liberal to Independent: Indi
Queensland
| |||||||||||||||||||||||||||||||||||||||||||||||||||||||||||||||||||||||
All 30 Queensland seats in the Australian House of Representatives and 6 (of the 12) seats in the Australian Senate | |||||||||||||||||||||||||||||||||||||||||||||||||||||||||||||||||||||||
|---|---|---|---|---|---|---|---|---|---|---|---|---|---|---|---|---|---|---|---|---|---|---|---|---|---|---|---|---|---|---|---|---|---|---|---|---|---|---|---|---|---|---|---|---|---|---|---|---|---|---|---|---|---|---|---|---|---|---|---|---|---|---|---|---|---|---|---|---|---|---|---|
| |||||||||||||||||||||||||||||||||||||||||||||||||||||||||||||||||||||||
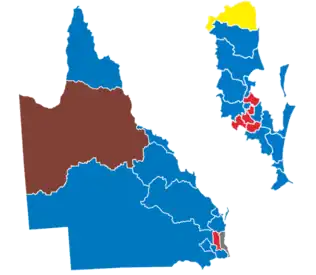
| |||||||||||||||||||||||||||||||||||||||||||||||||||||||||||||||||||||||
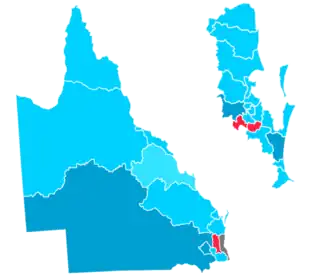
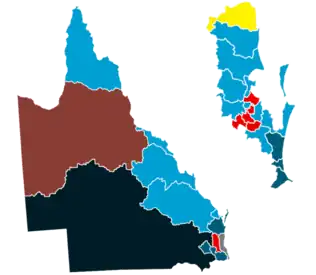
Electoral divisions: Queensland
Electoral divisions: Brisbane area
| Party | Votes | % | Swing | Seats | Change | |
|---|---|---|---|---|---|---|
| Liberal National | 1,152,217 | 45.66 | –1.76 | 22 | ||
| Labor | 751,230 | 29.77 | –3.81 | 6 | ||
| Palmer United | 278,125 | 11.02 | +11.02 | 1 | ||
| Greens | 156,884 | 6.22 | –4.70 | |||
| Katter's Australian | 94,540 | 3.75 | +2.15 | 1 | ||
| Family First | 51,375 | 2.04 | –1.85 | |||
| Rise Up Australia | 9,889 | 0.39 | +0.39 | |||
| Australian Sex Party | 2,859 | 0.11 | +0.11 | |||
| One Nation | 2,529 | 0.10 | −0.06 | |||
| Citizens Electoral Council | 2,292 | 0.09 | +0.03 | |||
| Aus. Independents | 1,901 | 0.08 | +0.08 | |||
| Secular | 1,808 | 0.07 | +0.05 | |||
| Australian Voice | 1,136 | 0.05 | +0.05 | |||
| Democratic Labour | 1,075 | 0.04 | −0.15 | |||
| Stable Population | 729 | 0.03 | +0.03 | |||
| Future | 481 | 0.02 | +0.02 | |||
| Uniting Australia | 386 | 0.02 | +0.02 | |||
| Socialist Alliance | 377 | 0.01 | −0.02 | |||
| Independents | 10,435 | 0.41 | −1.48 | 0 | ||
| Non Affiliated | 2,984 | 0.12 | +0.09 | |||
| Total | 2,523,252 | 30 | ||||
| Two-party-preferred vote | ||||||
| Liberal National | 1,437,803 | 56.98 | +1.84 | 22 | ||
| Labor | 1,085,449 | 43.02 | –1.84 | 6 | ||
Labor to LNP: Capricornia, Petrie
LNP to Palmer United: Fairfax
Western Australia
| |||||||||||||||||||||||||||||||||||||||||||||
All 15 West Australian seats in the Australian House of Representatives and 6 (of the 12) seats in the Australian Senate | |||||||||||||||||||||||||||||||||||||||||||||
|---|---|---|---|---|---|---|---|---|---|---|---|---|---|---|---|---|---|---|---|---|---|---|---|---|---|---|---|---|---|---|---|---|---|---|---|---|---|---|---|---|---|---|---|---|---|
| |||||||||||||||||||||||||||||||||||||||||||||
 Results by electorate | |||||||||||||||||||||||||||||||||||||||||||||
Electoral divisions: Western Australia
| Party | Votes | % | Swing | Seats | Change | |
|---|---|---|---|---|---|---|
| Liberal | 599,153 | 47.31 | +0.29 | 12 | ||
| Labor | 364,252 | 28.76 | –2.42 | 3 | ||
| Greens | 123,370 | 9.74 | –2.42 | |||
| Palmer United | 67,332 | 5.32 | +5.32 | |||
| National Party (WA) | 49,430 | 3.90 | +0.32 | 0 | ||
| Australian Christians | 25,649 | 2.03 | +2.03 | |||
| Family First | 11,777 | 0.93 | –0.79 | |||
| Rise Up Australia | 9,153 | 0.72 | +0.72 | |||
| Katter's Australian | 4,997 | 0.39 | +0.39 | |||
| Australian Sex Party | 2,236 | 0.18 | +0.01 | |||
| Citizens Electoral Council | 1,638 | 0.13 | +0.02 | |||
| Australian Sports | 1,324 | 0.10 | +0.10 | |||
| Australian Democrats | 1,170 | 0.09 | +0.09 | |||
| Protectionist | 923 | 0.07 | +0.07 | |||
| Socialist Alliance | 743 | 0.06 | −0.05 | |||
| Independents | 3,357 | 0.27 | –0.15 | |||
| Total | 1,266,504 | 15 | ||||
| Two-party-preferred vote | ||||||
| Liberal/National Coalition | 738,110 | 58.28 | +1.87 | 12 | ||
| Labor | 528,394 | 41.72 | –1.87 | 3 | ||
WA National to Liberal: O'Connor
South Australia
| ||||||||||||||||||||||||||||||||||
All 11 South Australian seats in the Australian House of Representatives and 6 (of the 12) seats in the Australian Senate | ||||||||||||||||||||||||||||||||||
|---|---|---|---|---|---|---|---|---|---|---|---|---|---|---|---|---|---|---|---|---|---|---|---|---|---|---|---|---|---|---|---|---|---|---|
| ||||||||||||||||||||||||||||||||||
 Results by electorate | ||||||||||||||||||||||||||||||||||
Electoral divisions: South Australia
| Party | Votes | % | Swing | Seats | Change | |
|---|---|---|---|---|---|---|
| Liberal | 447,286 | 44.49 | +4.28 | 6 | ||
| Labor | 359,273 | 35.73 | –5.01 | 5 | ||
| Greens | 83,252 | 8.28 | –3.70 | |||
| Family First | 54,409 | 5.41 | +0.45 | |||
| Palmer United | 37,981 | 3.78 | +3.78 | |||
| National Party (SA) | 4,021 | 0.40 | +0.40 | |||
| Katter's Australian | 2,268 | 0.23 | +0.23 | |||
| Rise Up Australia | 1,191 | 0.12 | +0.12 | |||
| Australia First | 1,116 | 0.11 | +0.11 | |||
| Socialist Alliance | 980 | 0.10 | +0.02 | |||
| Democratic Labour | 834 | 0.08 | +0.08 | |||
| Independents | 12,834 | 1.28 | +0.76 | |||
| Total | 1,005,445 | 11 | ||||
| Two-party-preferred vote | ||||||
| Liberal/National Coalition | 526,493 | 52.36 | +5.54 | 6 | ||
| Labor | 478,952 | 47.64 | –5.54 | 5 | ||
Labor to Liberal: Hindmarsh
Tasmania
| ||||||||||||||||||||||||||||||||||
All 5 Tasmanian seats in the House of Representatives and all 12 seats in the Senate | ||||||||||||||||||||||||||||||||||
|---|---|---|---|---|---|---|---|---|---|---|---|---|---|---|---|---|---|---|---|---|---|---|---|---|---|---|---|---|---|---|---|---|---|---|
| ||||||||||||||||||||||||||||||||||
 | ||||||||||||||||||||||||||||||||||
Electoral divisions: Tasmania
| Party | Votes | % | Swing | Seats | Change | ||
|---|---|---|---|---|---|---|---|
| Liberal | 132,961 | 40.26 | +6.66 | 3 | |||
| Labor | 114,977 | 34.81 | –9.14 | 1 | |||
| Greens | 27,467 | 8.32 | –8.50 | ||||
| Palmer United | 20,026 | 6.06 | +6.06 | ||||
| Family First | 4,971 | 1.51 | +1.51 | ||||
| Rise Up Australia | 1,824 | 0.55 | +0.55 | ||||
| Australian Christians | 963 | 0.29 | +0.29 | ||||
| Australian Sex Party | 877 | 0.27 | +0.27 | ||||
| Democratic Labour | 554 | 0.17 | +0.17 | ||||
| Katter's Australian | 478 | 0.14 | +0.14 | ||||
| Secular | 384 | 0.12 | –0.21 | ||||
| Stable Population | 124 | 0.04 | +0.04 | ||||
| Independents | 24,688 | 7.47 | +2.69 | 1 | |||
| Total | 330,294 | 5 | |||||
| Two-party-preferred vote | |||||||
| Labor | 169,208 | 51.23 | –9.39 | 1 | |||
| Liberal/National Coalition | 161,086 | 48.77 | +9.39 | 3 | |||
Independents: Andrew Wilkie
Territories
Australian Capital Territory
| ||||||||||||||||||||||||||||||||||
All 2 Australian Capital Territory seats in the Australian House of Representatives and all 2 seats in the Australian Senate | ||||||||||||||||||||||||||||||||||
|---|---|---|---|---|---|---|---|---|---|---|---|---|---|---|---|---|---|---|---|---|---|---|---|---|---|---|---|---|---|---|---|---|---|---|
| ||||||||||||||||||||||||||||||||||
 | ||||||||||||||||||||||||||||||||||
| Party | Votes | % | Swing | Seats | Change | |
|---|---|---|---|---|---|---|
| Labor | 103,676 | 42.93 | –2.09 | 2 | ||
| Liberal | 83,612 | 34.62 | −0.19 | 0 | ||
| Greens | 32,356 | 13.40 | –5.80 | |||
| Bullet Train | 9,855 | 4.08 | +4.08 | |||
| Palmer United | 6,788 | 2.81 | +2.81 | |||
| Australian Democrats | 2,444 | 1.01 | +1.01 | |||
| Rise Up Australia | 1,508 | 0.62 | +0.62 | |||
| Secular | 1,264 | 0.52 | −0.45 | |||
| Total | 241,503 | 2 | ||||
| Two-party-preferred vote | ||||||
| Labor | 144,688 | 59.91 | –1.76 | 2 | ||
| Liberal/National Coalition | 96,815 | 40.09 | +1.76 | 0 | ||
Northern Territory
| ||||||||||||||||||||||||||||||||||
All 2 Australian Capital Territory seats in the Australian House of Representatives and all 2 seats in the Australian Senate | ||||||||||||||||||||||||||||||||||
|---|---|---|---|---|---|---|---|---|---|---|---|---|---|---|---|---|---|---|---|---|---|---|---|---|---|---|---|---|---|---|---|---|---|---|
| ||||||||||||||||||||||||||||||||||
 Electorate Results | ||||||||||||||||||||||||||||||||||
| Party | Votes | % | Swing | Seats | Change | ||
|---|---|---|---|---|---|---|---|
| Country Liberal | 41,468 | 41.70 | +0.87 | 1 | |||
| Labor | 37,221 | 37.43 | –0.48 | 1 | |||
| Greens | 7,841 | 7.89 | –5.08 | ||||
| Palmer United | 4,609 | 4.63 | +4.63 | ||||
| Citizens Electoral Council | 1,856 | 1.87 | −0.61 | ||||
| Australian Sex Party | 1,847 | 1.86 | +1.86 | ||||
| First Nations | 1,810 | 1.82 | +1.82 | ||||
| Rise Up Australia | 1,444 | 1.45 | +1.45 | ||||
| Voluntary Euthanasia | 597 | 0.60 | +0.60 | ||||
| Independents | 748 | 0.75 | −3.46 | ||||
| Total | 99,441 | 2 | |||||
| Two-party-preferred vote | |||||||
| Liberal/National Coalition | 50,067 | 50.35 | +1.09 | 1 | |||
| Labor | 49,374 | 49.65 | –1.09 | 1 | |||
See also
- 2013 Australian federal election
- Results of the 2013 Australian federal election (Senate)
- Post-election pendulum for the 2013 Australian federal election
- Members of the Australian House of Representatives, 2013–2016
References
- ↑ Members Elected, AEC
- ↑ Barber, Stephen (8 September 2014). "Federal Election 2013" (PDF). Research Paper 2014–15. Parliamentary Library. ISSN 2203-5249.
- ↑ 2013 nationwide 2PP preference flows and 2010 flows: AEC
- ↑ First Preferences by Party – NSW, AEC
- ↑ First Preferences by Party – VIC, AEC
- ↑ First Preferences by Party - QLD, AEC
- ↑ First Preferences by Party - WA, AEC
- ↑ First Preferences by Party - SA, AEC
- ↑ First Preferences by Party - TAS, AEC
- ↑ First Preferences by Party - ACT, AEC
- ↑ First Preferences by Party - NT, AEC
| House of Representatives | |||
|---|---|---|---|
| Senate | |||
| By-elections | |||
This article is issued from Wikipedia. The text is licensed under Creative Commons - Attribution - Sharealike. Additional terms may apply for the media files.