| ||||||||||||||||||||||||||||||||||||||||
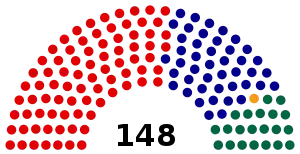
All 148 seats in the House of Representatives 75 seats were needed for a majority in the House 46 (of the 76) seats in the Senate | ||||||||||||||||||||||||||||||||||||||||
|---|---|---|---|---|---|---|---|---|---|---|---|---|---|---|---|---|---|---|---|---|---|---|---|---|---|---|---|---|---|---|---|---|---|---|---|---|---|---|---|---|
| Registered | 9,869,217 | |||||||||||||||||||||||||||||||||||||||
| Turnout | 9,295,421 (94.19%) ( | |||||||||||||||||||||||||||||||||||||||
| ||||||||||||||||||||||||||||||||||||||||
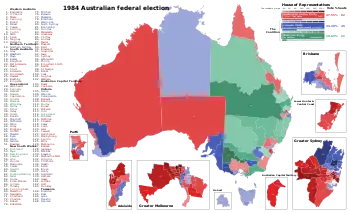 Results by division for the House of Representatives, shaded by winning party's margin of victory. | ||||||||||||||||||||||||||||||||||||||||
| ||||||||||||||||||||||||||||||||||||||||
1984 Australian federal election |
|---|
| National results |
| State and territory results |
|
|
|
The following tables show results for the Australian House of Representatives at the 1984 federal election held on 1 December 1984.[1][2]
Australia
| Party | Votes | % | Swing | Seats | Change | ||
|---|---|---|---|---|---|---|---|
| Labor | 4,120,130 | 47.55 | −1.93 | 82 | |||
| Liberal | 2,951,556 | 34.06 | −0.06 | 44 | |||
| National | 921,151 | 10.63 | +1.42 | 21 | |||
| Country Liberal | 27,335 | 0.32 | +0.08 | 1 | |||
| Liberal/National Coalition | 3,900,042 | 45.01 | –1.40 | 66 | |||
| Democrats | 472,204 | 5.45 | +0.42 | ||||
| Total | 8,664,952 | 148 | |||||
| Two-party-preferred | |||||||
| Labor | 4,484,622 | 51.77 | −1.46 | 82 | |||
| Liberal–National coalition | 4,178,572 | 48.23 | +1.46 | 66 | |||
| Invalid/blank votes | 630,469 | 6.8 | +4.7 | ||||
| Turnout | 9,295,421 | 94.2 | |||||
| Registered voters | 9,869,217 | ||||||
| Source: Federal Election Results 1949-1993 | |||||||
States
New South Wales
| ||||||||||||||||||||||||||||||||||
All 51 New South Wales seats in the Australian House of Representatives and 7 seats in the Australian Senate | ||||||||||||||||||||||||||||||||||
|---|---|---|---|---|---|---|---|---|---|---|---|---|---|---|---|---|---|---|---|---|---|---|---|---|---|---|---|---|---|---|---|---|---|---|
| ||||||||||||||||||||||||||||||||||
| Party | Votes | % | Swing | Seats | Change | ||
|---|---|---|---|---|---|---|---|
| Liberal | 990,464 | 32.76 | +1.21 | 12 | |||
| National | 318,458 | 10.53 | –0.43 | 10 | |||
| Liberal/National Coalition | 1,308,922 | 43.30 | +0.79 | 22 | |||
| Labor | 1,458,856 | 48.26 | –1.86 | 29 | |||
| Democrats | 178,806 | 5.91 | +1.12 | ||||
| Independent | 65,606 | 2.17 | +1.12 | ||||
| Nuclear Disarmament | 5,438 | 0.18 | +0.18 | ||||
| Socialist Workers | 4,261 | 0.14 | –0.55 | ||||
| Communist | 1,213 | 0.04 | –0.14 | ||||
| Total | 3,023,102 | 51 | |||||
| Two-party-preferred vote | |||||||
| Labor | 1,599,219 | 52.91 | +1.38 | ||||
| Liberal/National Coalition | 1,423,408 | 47.09 | –1.38 | ||||
| Invalid/blank votes | 198,648 | 6.2 | +4.0 | ||||
| Turnout | 3,221,750 | 94.1 | |||||
| Registered voters | 3,424,032 | ||||||
| Source: Federal Election Results 1949-1993 | |||||||
Victoria
| ||||||||||||||||||||||||||||||||||
All 39 Victorian seats in the Australian House of Representatives and 7 seats in the Australian Senate | ||||||||||||||||||||||||||||||||||
|---|---|---|---|---|---|---|---|---|---|---|---|---|---|---|---|---|---|---|---|---|---|---|---|---|---|---|---|---|---|---|---|---|---|---|
| ||||||||||||||||||||||||||||||||||
| Party | Votes | % | Swing | Seats | Change | ||
|---|---|---|---|---|---|---|---|
| Liberal | 842,423 | 36.88 | –0.20 | 11 | |||
| National | 145,435 | 6.37 | 1.50 | 3 | |||
| Liberal/National Coalition | 987,858 | 43.24 | 1.30 | 14 | |||
| Labor | 1,117,873 | 48.93 | –1.60 | 25 | |||
| Democrats | 115,172 | 5.04 | –0.70 | ||||
| Democratic Labor | 49,121 | 2.15 | |||||
| Independent | 8,925 | 0.39 | |||||
| Nuclear Disarmament | 2,702 | 0.12 | |||||
| Pensioner | 1,645 | 0.07 | |||||
| Socialist Workers | 1,236 | 0.05 | |||||
| Total | 2,284,532 | 39 | |||||
| Two-party-preferred vote | |||||||
| Labor | 1,212,308 | 53.09 | +4.85 | ||||
| Liberal/National Coalition | 1,071,270 | 46.91 | –4.85 | ||||
| Invalid/blank votes | 202,740 | 8.2 | +5.9 | ||||
| Turnout | 2,487,273 | 95.1 | |||||
| Registered voters | 2,614,383 | ||||||
| Source: Federal Election Results 1949-1993 | |||||||
Queensland
| ||||||||||||||||||||||||||||||||||
All 24 Queensland seats in the Australian House of Representatives and 7 seats in the Australian Senate | ||||||||||||||||||||||||||||||||||
|---|---|---|---|---|---|---|---|---|---|---|---|---|---|---|---|---|---|---|---|---|---|---|---|---|---|---|---|---|---|---|---|---|---|---|
| ||||||||||||||||||||||||||||||||||
| Party | Votes | % | Swing | Seats | Change | ||
|---|---|---|---|---|---|---|---|
| National | 435,832 | 31.70 | +7.95 | 8 | |||
| Liberal | 263,518 | 19.16 | –5.24 | 7 | |||
| Liberal/National Coalition | 699,350 | 50.86 | 2.72 | 15 | |||
| Labor | 605,813 | 44.06 | –2.08 | 9 | |||
| Democrats | 66,243 | 4.82 | +0.17 | ||||
| Independent | 3,043 | 0.22 | –0.13 | ||||
| Socialist Workers | 592 | 0.04 | –0.22 | ||||
| Total | 1,375,040 | 24 | |||||
| Two-party-preferred vote | |||||||
| Liberal/National Coalition | 718,873 | 52.29 | –2.26 | 15 | |||
| Labor | 656,029 | 47.71 | +2.26 | 9 | |||
| Invalid/blank votes | 65,803 | 4.6 | +1.3 | ||||
| Turnout | 1,440,843 | 92.7 | |||||
| Registered voters | 1,555,600 | ||||||
| Source: Federal Election Results 1949-1993 | |||||||
Western Australia
| ||||||||||||||||||||||||||||||||||
All 13 Western Australian seats in the Australian House of Representatives and 7 seats in the Australian Senate | ||||||||||||||||||||||||||||||||||
|---|---|---|---|---|---|---|---|---|---|---|---|---|---|---|---|---|---|---|---|---|---|---|---|---|---|---|---|---|---|---|---|---|---|---|
| ||||||||||||||||||||||||||||||||||
| Party | Votes | % | Swing | Seats | Change | ||
|---|---|---|---|---|---|---|---|
| Liberal | 341,500 | 45.74 | 3.92 | 4 | |||
| National | 9,817 | 1.31 | -0.02 | ||||
| Liberal/National Coalition | 351,317 | 47.05 | 3.90 | 4 | |||
| Labor | 359,810 | 48.19 | -3.76 | 9 | |||
| Democrats | 27,598 | 3.70 | -0.32 | ||||
| Independents | 3,791 | 0.51 | 0.06 | ||||
| Nuclear Disarmament | 2,623 | 0.35 | |||||
| Socialist Workers | 1,535 | 0.21 | -0.09 | ||||
| Total | 746,674 | 13 | |||||
| Two-party-preferred vote | |||||||
| Labor | 379,731 | 50.86 | 2.27 | 9 | |||
| Liberal/National Coalition | 366,912 | 49.14 | -2.27 | 4 | |||
| Invalid/blank votes | 59,801 | 7.42 | 5.44 | ||||
| Turnout | 806,475 | 93.82 | |||||
| Registered voters | 859,623 | ||||||
| Source: Federal Election Results 1949-1993 | |||||||
South Australia
| ||||||||||||||||||||||||||||||||||
All 13 South Australian seats in the Australian House of Representatives and 7 seats in the Australian Senate | ||||||||||||||||||||||||||||||||||
|---|---|---|---|---|---|---|---|---|---|---|---|---|---|---|---|---|---|---|---|---|---|---|---|---|---|---|---|---|---|---|---|---|---|---|
| ||||||||||||||||||||||||||||||||||
| Party | Votes | % | Swing | Seats | Change | ||
|---|---|---|---|---|---|---|---|
| Liberal | 337,253 | 42.97 | 0.87 | 5 | |||
| National | 11,609 | 1.48 | 1.48 | ||||
| Liberal/National Coalition | 348,862 | 44.45 | 2.35 | 5 | |||
| Labor | 367,915 | 46.87 | -1.51 | 8 | |||
| Democrats | 61,822 | 7.88 | 0.94 | ||||
| Nuclear Disarmament | 2,270 | 0.29 | |||||
| Independent | 2,205 | 0.28 | -0.14 | ||||
| Socialist Workers | 1,836 | 0.23 | -0.65 | ||||
| Total | 784,910 | 13 | |||||
| Two-party-preferred vote | |||||||
| Labor | 405,496 | 51.67 | -0.63 | 8 | |||
| Liberal/National Coalition | 379,305 | 48.33 | 0.63 | 5 | |||
| Invalid/blank votes | 74,719 | 8.69 | 6.02 | ||||
| Turnout | 859,629 | 94.85 | |||||
| Registered voters | 906,278 | ||||||
| Source: Federal Election Results 1949-1993 | |||||||
Tasmania
| ||||||||||||||||||||||||||||||||||
All 5 Tasmanian seats in the Australian House of Representatives and 7 seats in the Australian Senate | ||||||||||||||||||||||||||||||||||
|---|---|---|---|---|---|---|---|---|---|---|---|---|---|---|---|---|---|---|---|---|---|---|---|---|---|---|---|---|---|---|---|---|---|---|
| ||||||||||||||||||||||||||||||||||
| Party | Votes | % | Swing | Seats | Change | ||
|---|---|---|---|---|---|---|---|
| Liberal | 133,173 | 51.13 | -3.78 | 5 | |||
| Labor | 113,094 | 43.42 | 3.14 | ||||
| Democrats | 10,432 | 4.01 | 0.44 | ||||
| Independent | 3,747 | 1.44 | 0.46 | ||||
| Total | 260,446 | 5 | |||||
| Two-party-preferred vote | |||||||
| Liberal | 138,983 | 53.37 | -3.05 | 5 | |||
| Labor | 121,438 | 46.63 | 3.05 | 0 | |||
| Invalid/blank votes | 16,237 | 5.87 | 3.57 | ||||
| Turnout | 276,683 | 95.40 | |||||
| Registered voters | 290,028 | ||||||
| Source: Federal Election Results 1949-1993 | |||||||
Territories
Australian Capital Territory
| ||||||||||||||||||||||||||||||||||
Both Australian Capital Territory seats in the Australian House of Representatives and both seats in the Australian Senate | ||||||||||||||||||||||||||||||||||
|---|---|---|---|---|---|---|---|---|---|---|---|---|---|---|---|---|---|---|---|---|---|---|---|---|---|---|---|---|---|---|---|---|---|---|
| ||||||||||||||||||||||||||||||||||
| Party | Votes | % | Swing | Seats | Change | ||
|---|---|---|---|---|---|---|---|
| Labor | 71,637 | 53.34 | -10.56 | 2 | |||
| Liberal | 43,225 | 32.19 | +0.15 | 0 | |||
| Democrats | 10,225 | 7.61 | |||||
| Nuclear Disarmament | 4,945 | 3.68 | |||||
| Deadly Serious | 2,826 | 2.10 | -0.86 | ||||
| Independents | 1,435 | 1.07 | -0.03 | ||||
| Total | 134,293 | 5 | |||||
| Two-party-preferred vote | |||||||
| Labor | 83,207 | 61.96 | -3.53 | 2 | |||
| Liberal | 51,074 | 38.04 | 3.53 | 0 | |||
| Invalid/blank votes | 7,204 | 5.09 | 2.88 | ||||
| Turnout | 141,497 | 94.07 | |||||
| Registered voters | 150,416 | ||||||
| Source: Federal Election Results 1949-1993 | |||||||
Northern Territory
| ||||||||||||||||||||||||||||||||||
The one Northern Territory seat in the Australian House of Representatives and both seats in the Australian Senate | ||||||||||||||||||||||||||||||||||
|---|---|---|---|---|---|---|---|---|---|---|---|---|---|---|---|---|---|---|---|---|---|---|---|---|---|---|---|---|---|---|---|---|---|---|
| ||||||||||||||||||||||||||||||||||
| Party | Candidate | Votes | % | ±% | |
|---|---|---|---|---|---|
| Country Liberal | Paul Everingham | 27,335 | 48.8 | +2.0 | |
| Labor | John Reeves | 25,140 | 44.9 | -1.7 | |
| Democrats | Wiyendji Roberts | 1,906 | 3.4 | -0.1 | |
| Independent | Phil Ward | 1,191 | 2.1 | +2.1 | |
| Independent | Strider | 390 | 0.7 | +0.1 | |
| Total formal votes | 55,962 | 95.1 | |||
| Informal votes | 2,909 | 4.9 | |||
| Turnout | 58,871 | 85.5 | |||
| Two-party-preferred result | |||||
| Country Liberal | Paul Everingham | 28,747 | 51.4 | +3.3 | |
| Labor | John Reeves | 27,194 | 48.6 | -3.3 | |
| Country Liberal gain from Labor | Swing | +3.3 | |||
See also
References
- ↑ "Federal Election Results 1949-1993" (PDF). Parliament of Australia. Retrieved 26 June 2022.
- 1 2 3 4 5 6 7 8 "1984 House of Representatives". Psephos Adam Carr's Election Archive. Retrieved 15 June 2022.
- ↑ "1984 House of Representatives: Northern Territory". Psephos Adam Carr's Election Archive. Retrieved 22 June 2022.
| House of Representatives | |||
|---|---|---|---|
| Senate | |||
| By-elections | |||
This article is issued from Wikipedia. The text is licensed under Creative Commons - Attribution - Sharealike. Additional terms may apply for the media files.