| ||||||||||||||||||||||||||||||||||
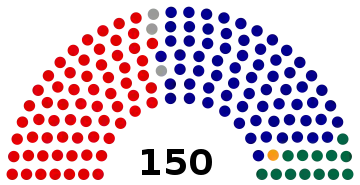
All 150 seats in the Australian House of Representatives 76 seats needed for a majority | ||||||||||||||||||||||||||||||||||
| Turnout | 94.3% | |||||||||||||||||||||||||||||||||
|---|---|---|---|---|---|---|---|---|---|---|---|---|---|---|---|---|---|---|---|---|---|---|---|---|---|---|---|---|---|---|---|---|---|---|
This lists parties that won seats. See the complete results below.
| ||||||||||||||||||||||||||||||||||
2001 Australian federal election |
|---|
| National results |
| State and territory results |
|
|
The following tables show results for the Australian House of Representatives at the 2001 federal election held on 10 November 2001. The parliament increased from 148 to 150 seats, with a new seat in Western Australia and a new seat in the Northern Territory.
Australia
| Party | Votes | % | Swing | Seats | Change | |||
|---|---|---|---|---|---|---|---|---|
| Liberal | 4,254,072 | 37.08 | +3.19 | 68 | ||||
| National | 643,926 | 5.61 | +0.32 | 13 | ||||
| Country Liberal | 36,961 | 0.32 | –0.00 | 1 | ||||
| Liberal–National coalition | 4,934,959 | 42.92 | +3.41 | 82 | ||||
| Labor | 4,341,420 | 37.84 | −2.26 | 65 | ||||
| Democrats | 620,197 | 5.41 | +0.28 | 0 | ||||
| Greens | 569,074 | 4.96 | +2.82 | 0 | ||||
| One Nation | 498,032 | 4.34 | −4.09 | 0 | ||||
| Independents | 332,118 | 2.89 | +1.00 | 3 | ||||
| Total | 11,474,074 | 150 | ||||||
| Two-party-preferred vote | ||||||||
| Coalition | 5,655,791 | 51.03 | +2.01 | 82 | ||||
| Labor | 5,427,569 | 48.97 | −2.01 | 65 | ||||
| Invalid/blank votes | 580,362 | 4.81 | +1.04 | |||||
| Turnout | 12,054,455 | 95.39 | ||||||
| Registered voters | 12,636,631 | |||||||
| Source: AEC Tally Room | ||||||||
Independents: Peter Andren, Tony Windsor, Bob Katter
States
New South Wales
| ||||||||||||||||||||||||||||||||||
All 50 New South Wales seats in the Australian House of Representatives and 6 seats in the Australian Senate | ||||||||||||||||||||||||||||||||||
|---|---|---|---|---|---|---|---|---|---|---|---|---|---|---|---|---|---|---|---|---|---|---|---|---|---|---|---|---|---|---|---|---|---|---|
| ||||||||||||||||||||||||||||||||||
| Party | Votes | % | Swing | Seats | Change | ||
|---|---|---|---|---|---|---|---|
| Liberal | 1,272,208 | 33.58 | 3.09 | 21 | |||
| National | 349,372 | 9.22 | 1.32 | 7 | |||
| Liberal/National Coalition | 1,621,580 | 42.80 | 4.41 | 28 | |||
| Labor | 1,380,822 | 36.45 | –3.67 | 20 | |||
| One Nation | 180,812 | 4.77 | –4.19 | ||||
| Greens | 180,079 | 4.75 | 2.09 | ||||
| Democrats | 160,706 | 4.24 | 0.08 | ||||
| Independent | 148,042 | 3.91 | 3.02 | 2 | |||
| Christian Democrats | 46,059 | 1.22 | 0.19 | ||||
| Unity | 24,653 | 0.65 | –0.90 | ||||
| Against Further Immigration | 12,033 | 0.32 | |||||
| Save the ADI Site | 6,029 | 0.16 | |||||
| Citizens Electoral Council | 5,746 | 0.15 | |||||
| No GST | 4,858 | 0.13 | |||||
| Progressive Labour | 4,467 | 0.12 | |||||
| Lower Excise Fuel | 3,098 | 0.08 | |||||
| HEMP | 2,193 | 0.06 | |||||
| Non-Custodial Parents | 0,769 | 0.02 | |||||
| Fishing Party | 0,720 | 0.02 | |||||
| Total | 3,788,459 | 50 | |||||
| Two-party-preferred vote | |||||||
| Liberal/National Coalition | 1,811,019 | 52.14 | +3.68 | 28 | |||
| Labor | 1,662,190 | 48.46 | –3.68 | 20 | |||
| Invalid/blank votes | 217,024 | 5.42 | +1.41 | ||||
| Turnout | 4,005,483 | 95.27 | |||||
| Registered voters | 4,204,383 | ||||||
| Source: AEC Tally Room | |||||||
Victoria
| ||||||||||||||||||||||||||||||||||
All 37 Victoria seats in the Australian House of Representatives and 6 seats in the Australian Senate | ||||||||||||||||||||||||||||||||||
|---|---|---|---|---|---|---|---|---|---|---|---|---|---|---|---|---|---|---|---|---|---|---|---|---|---|---|---|---|---|---|---|---|---|---|
| ||||||||||||||||||||||||||||||||||
| Party | Votes | % | Swing | Seats | Change | |||
|---|---|---|---|---|---|---|---|---|
| Liberal | 1,154,493 | 39.07 | 1.99 | 15 | ||||
| National | 91,049 | 3.08 | 0.36 | 2 | ||||
| Liberal/National Coalition | 1,245,542 | 42.15 | 2.35 | 17 | ||||
| Labor | 1,230,757 | 41.65 | –2.72 | 20 | ||||
| Democrats | 184,582 | 6.25 | 0.23 | |||||
| Greens | 174,399 | 5.90 | 3.81 | |||||
| Independents | 60,801 | 0.02 | ||||||
| One Nation | 37,811 | 1.28 | –2.44 | |||||
| Citizens Electoral Council | 6,692 | 0.23 | 0.08 | |||||
| Christian Democrats | 6,188 | 0.21 | 0.08 | |||||
| No GST | 5,104 | 0.17 | ||||||
| Liberals for Forests | 1,960 | 0.07 | ||||||
| Lower Excise Fuel | 1,194 | 0.04 | ||||||
| Total | 2,955,031 | 37 | ||||||
| Two-party-preferred vote | ||||||||
| Labor | 1,540,614 | 52.14 | –1.39 | 20 | ||||
| Liberal/National Coalition | 1,414,417 | 46.47 | +1.39 | 17 | ||||
| Invalid/blank votes | 122,525 | 3.68 | +0.47 | |||||
| Turnout | 2,955,031 | 95.61 | ||||||
| Registered voters | 3,218,746 | |||||||
| Source: AEC Tally Room | ||||||||
Queensland
| ||||||||||||||||||||||||||||||||||
All 27 Queensland seats in the Australian House of Representatives and 6 seats in the Australian Senate | ||||||||||||||||||||||||||||||||||
|---|---|---|---|---|---|---|---|---|---|---|---|---|---|---|---|---|---|---|---|---|---|---|---|---|---|---|---|---|---|---|---|---|---|---|
| ||||||||||||||||||||||||||||||||||
| Party | Votes | % | Swing | Seats | Change | |||
|---|---|---|---|---|---|---|---|---|
| Liberal | 767,959 | 36.46 | 5.60 | 15 | ||||
| National | 192,451 | 9.14 | –0.86 | 4 | ||||
| Liberal/National Coalition | 960,410 | 45.60 | +4.74 | 19 | ||||
| Labor | 730,920 | 34.70 | –1.40 | 7 | ||||
| One Nation | 148,930 | 7.07 | –7.28 | 0 | ||||
| Independent | 148,620 | 7.06 | 1 | |||||
| Democrats | 90,679 | 4.31 | 0.29 | |||||
| Greens | 73,467 | 3.49 | 1.11 | |||||
| Citizens Electoral Council | 2,849 | 0.14 | ||||||
| HEMP | 1,084 | 0.05 | ||||||
| Outdoor Recreation | 485 | 0.02 | ||||||
| Total | 2,106,255 | 28 | ||||||
| Two-party-preferred vote | ||||||||
| Liberal | 1,110,905 | 53.05 | +1.65 | 19 | ||||
| Labor | 919,867 | 46.95 | –1.65 | 7 | ||||
| Invalid/blank votes | 106,976 | 4.83 | +1.50 | |||||
| Turnout | 2,213,231 | 95.42 | ||||||
| Registered voters | 2,319,481 | |||||||
| Source: AEC Tally Room | ||||||||
Western Australia
| ||||||||||||||||||||||||||||||||||
All 15 Western Australian seats in the Australian House of Representatives and 6 seats in the Australian Senate | ||||||||||||||||||||||||||||||||||
|---|---|---|---|---|---|---|---|---|---|---|---|---|---|---|---|---|---|---|---|---|---|---|---|---|---|---|---|---|---|---|---|---|---|---|
| ||||||||||||||||||||||||||||||||||
| Party | Votes | % | Swing | Seats | Change | ||
|---|---|---|---|---|---|---|---|
| Liberal | 449,036 | 41.39 | +3.24 | 8 | |||
| Labor | 402,927 | 37.14 | -0.29 | 7 | |||
| One Nation | 67,992 | 6.27 | -3.01 | ||||
| Greens | 64,939 | 5.99 | +0.93 | ||||
| Democrats | 50,581 | 4.66 | +0.70 | ||||
| Liberals for Forests | 13,116 | 1.21 | |||||
| Christian Democrats | 12,792 | 1.18 | |||||
| National | 11,052 | 1.02 | |||||
| Independent | 6,957 | 0.64 | |||||
| Citizens Electoral Council | 2,907 | 0.27 | |||||
| Curtin Labor Alliance | 2,496 | 0.23 | |||||
| Total | 1,084,795 | 15 | |||||
| Two-party-preferred vote | |||||||
| Liberal | 559,926 | 51.62 | 1.08 | 8 | |||
| Labor | 524,869 | 48.38 | -1.08 | 7 | |||
South Australia
| ||||||||||||||||||||||||||||||||||
All 12 South Australian seats in the Australian House of Representatives and 6 seats in the Australian Senate | ||||||||||||||||||||||||||||||||||
|---|---|---|---|---|---|---|---|---|---|---|---|---|---|---|---|---|---|---|---|---|---|---|---|---|---|---|---|---|---|---|---|---|---|---|
| ||||||||||||||||||||||||||||||||||
| Party | Votes | % | Swing | Seats | Change | |
|---|---|---|---|---|---|---|
| Liberal | 430,442 | 45.90 | 3.85 | 9 | ||
| Labor | 316,362 | 33.74 | -0.74 | 3 | ||
| Democrats | 98,849 | 10.54 | 0.40 | |||
| One Nation | 44,574 | 4.75 | -5.05 | |||
| Greens | 34,141 | 3.64 | 3.15 | |||
| Independents | 7,921 | 0.80 | ||||
| No GST | 4,202 | 0.42 | +0.42 | |||
| Communist | 0,672 | 0.07 | ||||
| Total | 937,708 | 12 | ||||
| Two-party-preferred vote | ||||||
| Liberal | 45.92 | -0.97 | 9 | |||
| Labor | 54.08 | 0.97 | 3 | |||
Tasmania
| ||||||||||||||||||||||||||||||||||
All 5 Tasmanian seats in the Australian House of Representatives and 6 seats in the Australian Senate | ||||||||||||||||||||||||||||||||||
|---|---|---|---|---|---|---|---|---|---|---|---|---|---|---|---|---|---|---|---|---|---|---|---|---|---|---|---|---|---|---|---|---|---|---|
| ||||||||||||||||||||||||||||||||||
| Party | Votes | % | Swing | Seats | Change | ||
|---|---|---|---|---|---|---|---|
| Labor | 145,305 | 47.17 | –1.73 | 5 | |||
| Liberal | 114,283 | 37.10 | –1.07 | 0 | |||
| Greens | 24,052 | 7.81 | +2.25 | ||||
| Democrats | 13,785 | 4.48 | +1.22 | ||||
| One Nation | 8,847 | 2.87 | +0.42 | ||||
| Liberals for Forests | 966 | 1.59 | +1.59 | ||||
| Tasmania First | 621 | 1.02 | –0.89 | ||||
| Citizens Electoral Council | 159 | 0.26 | +0.26 | ||||
| Total | 308,018 | 5 | |||||
| Two-party-preferred vote | |||||||
| Labor | 57.73 | +0.41 | 5 | ||||
| Liberal | 42.27 | –0.41 | 0 | ||||
Territories
Australian Capital Territory
| ||||||||||||||||||||||||||||||||||
All 2 Australian Capital Territory seats in the Australian House of Representatives and all 2 seats in the Australian Senate | ||||||||||||||||||||||||||||||||||
|---|---|---|---|---|---|---|---|---|---|---|---|---|---|---|---|---|---|---|---|---|---|---|---|---|---|---|---|---|---|---|---|---|---|---|
| ||||||||||||||||||||||||||||||||||
| Party | Votes | % | Swing | Seats | Change | |
|---|---|---|---|---|---|---|
| Labor | 95,215 | 46.98 | –3.66 | 2 | ||
| Liberal | 65,651 | 32.39 | 1.87 | 0 | ||
| Democrats | 16,266 | 8.03 | 0.63 | |||
| Greens | 14,335 | 7.07 | 2.89 | |||
| One Nation | 5,576 | 2.75 | –2.33 | |||
| Christian Democrats | 5,623 | 2.77 | 0.60 | |||
| Total | 202,666 | 2 | ||||
| Two-party-preferred vote | ||||||
| Labor | 61.08 | –1.36 | 2 | |||
| Liberal | 38.92 | 1.36 | 0 | |||
Northern Territory
| ||||||||||||||||||||||||||||||||||
All 2 Northern Territory seats in the Australian House of Representatives and all 2 seats in the Australian Senate | ||||||||||||||||||||||||||||||||||
|---|---|---|---|---|---|---|---|---|---|---|---|---|---|---|---|---|---|---|---|---|---|---|---|---|---|---|---|---|---|---|---|---|---|---|
| ||||||||||||||||||||||||||||||||||
| Party | Votes | % | Swing | Seats | Change | |
|---|---|---|---|---|---|---|
| Labor | 39,111 | 42.90 | 0.60 | 1 | ||
| Country Liberal | 36,961 | 40.54 | 0.94 | 1 | ||
| Democrats | 4,795 | 5.26 | 0.14 | |||
| Greens | 3,665 | 4.02 | 0.99 | |||
| One Nation | 3,486 | 3.82 | -4.31 | |||
| Independents | 3,143 | 3.45 | 2.33 | |||
| Total | 91,161 | 2 | ||||
| Two-party-preferred vote | ||||||
| Labor | 52.49 | 1.92 | 1 | |||
| Country Liberal | 47.51 | –1.92 | 1 | |||
References
- ↑ "2001 First preference votes for New South Wales". Australian Electoral Commission. Retrieved 8 June 2022.
- ↑ "2001 First preference votes for Victoria". Australian Electoral Commission. Retrieved 8 June 2022.
- ↑ "2001 First preference votes for Queensland". Australian Electoral Commission. Retrieved 8 June 2022.
- ↑ "2001 First preference votes for Western Australia". Australian Electoral Commission. Retrieved 8 June 2022.
- ↑ "2001 First preference votes for South Australia". Australian Electoral Commission. Retrieved 8 June 2022.
- ↑ "2001 First preference votes for Tasmania". Australian Electoral Commission. Retrieved 8 June 2022.
- ↑ "2001 First preference votes for the Australian Capital Territory". Australian Electoral Commission. Retrieved 7 June 2022.
- ↑ "2001 First preference votes for the Northern Territory". Australian Electoral Commission. Retrieved 7 June 2022.
| House of Representatives | |||
|---|---|---|---|
| Senate | |||
| By-elections | |||
This article is issued from Wikipedia. The text is licensed under Creative Commons - Attribution - Sharealike. Additional terms may apply for the media files.