| ||||||||||||||||||||||||||||||||||||||||||||||||||||||
All 150 seats in the Australian House of Representatives 76 seats needed for a majority | ||||||||||||||||||||||||||||||||||||||||||||||||||||||
| Turnout | 93.2% | |||||||||||||||||||||||||||||||||||||||||||||||||||||
|---|---|---|---|---|---|---|---|---|---|---|---|---|---|---|---|---|---|---|---|---|---|---|---|---|---|---|---|---|---|---|---|---|---|---|---|---|---|---|---|---|---|---|---|---|---|---|---|---|---|---|---|---|---|---|
This lists parties that won seats. See the complete results below.
| ||||||||||||||||||||||||||||||||||||||||||||||||||||||
2010 Australian federal election |
|---|
| National results |
| State and territory results |
|
|
|
The following tables show state-by-state results in the Australian House of Representatives at the 2010 federal election, Labor 72, Coalition 72, Nationals (WA) 1, Australian Greens 1, with 4 independents.[1][2][3][4]
Australia
| Party | Votes | % | Swing | Seats | Change | ||
|---|---|---|---|---|---|---|---|
| Liberal | 3,777,383 | 30.46 | +0.76 | 44 | |||
| Liberal National Party (QLD) [lower-alpha 1] | 1,130,525 | 9.12 | +0.60 | 21 | |||
| National | 419,286 | 3.43 | −0.04 | 6 | |||
| Country Liberal (NT) | 38,335 | 0.31 | −0.01 | 1 | |||
| Coalition | 5,365,529 | 43.32 | +1.31 | 72 | |||
| Australian Labor Party | 4,711,363 | 37.99 | −5.40 | 72 | |||
| Australian Greens | 1,458,998 | 11.76 | +3.97 | 1 | |||
| Independents | 312,496 | 2.52 | +0.30 | 4 [lower-alpha 2] | |||
| National (WA) [lower-alpha 3] | 43,101 | 0.34 | +0.20 | 1 | |||
| Total | 12,402,363 | 150 | |||||
| Two-party-preferred vote | |||||||
| Australian Labor Party | 6,216,445 | 50.12 | −2.58 | 72 | |||
| Liberal/National Coalition | 6,185,918 | 49.88 | +2.58 | 72 | |||
| Invalid/blank votes | 729,304 | 5.55 | +1.60 | ||||
| Registered voters/turnout | 14,086,869 | 93.22 | |||||
| Source: Commonwealth Election 2010 | |||||||

- Preference flows
- Greens − Labor 78.8% (-0.9) to Coalition 21.2% (+0.9)
- Family First − Coalition 59.8% (-0.5) to Labor 40.2% (+0.5)
- Christian Democrats − Coalition 73.5% (+3.9) to Labor 26.5% (-3.9)
- Nationals WA − Coalition 75.9% (-5.1) to Labor 24.1% (+5.1)
- Independent candidates − Coalition 56.5% (+1.9) to Labor 43.5% (-1.9)[5]
New South Wales
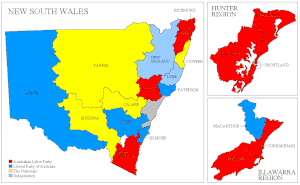
Electoral divisions: New South Wales
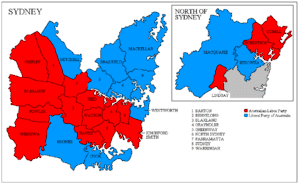
Electoral divisions: Sydney area
| Party | Votes | % | Swing | Seats | Change | ||
|---|---|---|---|---|---|---|---|
| Liberal | 1,470,146 | 36.67 | +4.04 | 16 | |||
| National | 317,867 | 7.93 | +0.02 | 4 | |||
| Coalition | 1,788,013 | 44.60 | +4.06 | 20 | |||
| Australian Labor Party | 1,494,490 | 37.28 | −6.86 | 26 | |||
| Australian Greens | 410,405 | 10.24 | +2.35 | ||||
| Independents | 172,921 | 4.31 | +1.00 | 2 [lower-alpha 2] | |||
| Christian Democratic Party | 54,544 | 1.36 | −0.56 | ||||
| One Nation | 19,182 | 0.48 | +0.27 | ||||
| Family First Party | 17,453 | 0.44 | −0.43 | ||||
| Australian Democrats | 11,409 | 0.28 | +0.01 | ||||
| Socialist Equality Party | 9,106 | 0.23 | +0.15 | ||||
| Liberal Democratic Party | 8,928 | 0.22 | +0.10 | ||||
| Secular Party of Australia | 3,529 | 0.09 | +0.09 | ||||
| Socialist Alliance | 3,484 | 0.09 | +0.03 | ||||
| Australia First Party | 3,375 | 0.08 | +0.08 | ||||
| Australian Sex Party | 3,180 | 0.08 | +0.08 | ||||
| Non-Custodial Parents Party | 2,835 | 0.07 | +0.05 | ||||
| Building Australia Party | 1,497 | 0.04 | +0.04 | ||||
| Carers Alliance | 1,458 | 0.04 | +0.04 | ||||
| Citizens Electoral Council | 1,187 | 0.03 | −0.19 | ||||
| Communist Alliance | 656 | 0.02 | +0.02 | ||||
| The Climate Sceptics | 275 | 0.01 | +0.01 | ||||
| Others | 1,391 | 0.03 | +0.01 | ||||
| Total | 4,009,318 | 48 | |||||
| Two-party-preferred vote | |||||||
| Australian Labor Party | 1,958,077 | 48.84 | –4.84 | 26 | |||
| Liberal/National Coalition | 2,051,241 | 51.16 | +4.84 | 20 | |||
| Invalid/blank votes | 293,763 | 6.83 | +1.88 | ||||
| Registered voters/turnout | 4,610,795 | 93.33 | |||||
| Source: Commonwealth Election 2010 | |||||||
Victoria
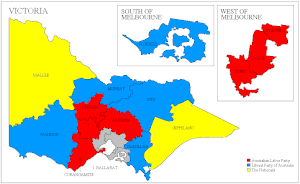
Electoral divisions: Victoria
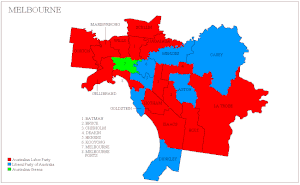
Electoral divisions: Melbourne area
| Party | Votes | % | Swing | Seats | Change | ||
|---|---|---|---|---|---|---|---|
| Australian Labor Party | 1,361,416 | 42.81 | –1.88 | 22 | |||
| Liberal | 1,159,301 | 36.45 | –1.64 | 12 | |||
| National | 101,419 | 3.19 | +0.17 | 2 | |||
| Coalition | 1,260,720 | 39.64 | –1.47 | 14 | |||
| Australian Greens | 402,482 | 12.66 | +4.49 | 1 | |||
| Family First Party | 99,747 | 3.14 | +0.12 | ||||
| Independents | 26,525 | 0.83 | −0.17 | ||||
| Liberal Democratic Party | 7,839 | 0.25 | +0.15 | ||||
| Australian Sex Party | 6,023 | 0.19 | +0.19 | ||||
| Secular Party of Australia | 5,239 | 0.16 | +0.16 | ||||
| Australian Democrats | 3,947 | 0.12 | −1.10 | ||||
| Socialist Alliance | 2,225 | 0.07 | +0.00 | ||||
| Socialist Equality Party | 1,656 | 0.05 | +0.03 | ||||
| Citizens Electoral Council | 922 | 0.03 | −0.24 | ||||
| Christian Democratic Party | 632 | 0.02 | −0.02 | ||||
| Australia First Party | 295 | 0.01 | +0.01 | ||||
| Others | 516 | 0.02 | +0.00 | ||||
| Total | 3,180,184 | 37 | |||||
| Two-party-preferred vote | |||||||
| Australian Labor Party | 1,758,982 | 55.31 | +1.04 | 22 | |||
| Liberal/National Coalition | 1,421,202 | 44.69 | –1.04 | 14 | |||
| Invalid/blank votes | 149,699 | 4.50 | +1.25 | ||||
| Registered voters/turnout | 3,561,873 | 93.49 | |||||
| Source: Commonwealth Election 2010 | |||||||
Queensland
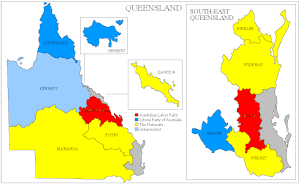
Electoral divisions: Queensland
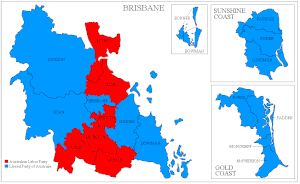
Electoral divisions: Brisbane area
| Party | Votes | % | Swing | Seats | Change | |
|---|---|---|---|---|---|---|
| Liberal National Party | 1,130,525 | 47.42 | +2.95 | 21 | ||
| Australian Labor Party | 800,712 | 33.58 | –9.33 | 8 | ||
| Australian Greens | 260,471 | 10.92 | +5.29 | |||
| Family First Party | 92,794 | 3.89 | +1.62 | |||
| Independents | 83,310 | 3.49 | +0.50 | 1 [lower-alpha 2] | ||
| Liberal Democratic Party | 4,662 | 0.20 | +0.05 | |||
| Democratic Labor Party | 4,590 | 0.19 | +0.19 | |||
| One Nation | 3,921 | 0.16 | −0.20 | |||
| Citizens Electoral Council | 1,462 | 0.06 | −0.09 | |||
| Socialist Alliance | 717 | 0.03 | −0.02 | |||
| Secular Party of Australia | 414 | 0.02 | +0.02 | |||
| Others | 601 | 0.03 | +0.03 | |||
| Total | 2,384,179 | 30 | ||||
| Two-party-preferred vote | ||||||
| Liberal National Party | 1,314,675 | 55.14 | +5.58 | 21 | ||
| Australian Labor Party | 1,069,504 | 44.86 | –5.58 | 8 | ||
| Invalid/blank votes | 137,395 | 5.45 | +1.89 | |||
| Registered voters/turnout | 2,719,360 | 92.73 | ||||
| Source: Commonwealth Election 2010 | ||||||
Western Australia
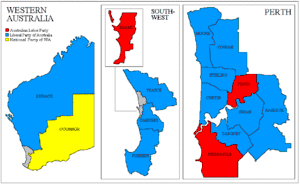
Electoral divisions: Western Australia
| Party | Votes | % | Swing | Seats | Change | |
|---|---|---|---|---|---|---|
| Liberal | 566,145 | 47.02 | +0.71 | 11 | ||
| Labor | 375,381 | 31.18 | –5.62 | 3 | ||
| Greens | 158,117 | 13.13 | +4.20 | |||
| National[lower-alpha 3] | 43,101 | 3.58 | +2.44 | 1 | ||
| Christian Democrats | 27,833 | 2.31 | +0.20 | |||
| Family First | 20,698 | 1.72 | +0.51 | |||
| Independents | 5,079 | 0.42 | –1.27 | |||
| Sex Party | 2,060 | 0.17 | +0.17 | |||
| One Nation | 1,471 | 0.12 | −1.03 | |||
| Socialist Alliance | 1,280 | 0.11 | +0.01 | |||
| Citizens Electoral Council | 1,277 | 0.11 | −0.15 | |||
| Democratic Labour | 622 | 0.05 | +0.05 | |||
| Climate Sceptics | 539 | 0.04 | +0.04 | |||
| Socialist Equality | 398 | 0.03 | +0.02 | |||
| Total | 1,204,001 | 15 | ||||
| Two-party-preferred vote | ||||||
| Liberal | 679,140 | 56.41 | +3.15 | 11 | ||
| Labor | 524,861 | 43.59 | –3.15 | 3 | ||
| Invalid/blank votes | 60,967 | 4.82 | +0.97 | |||
| Registered voters/turnout | 1,362,534 | 92.84 | ||||
| Source: Commonwealth Election 2010 | ||||||
South Australia
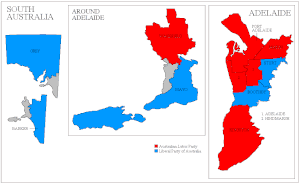
Electoral divisions: South Australia
| Party | Votes | % | Swing | Seats | Change | |
|---|---|---|---|---|---|---|
| Australian Labor Party | 399,279 | 40.74 | –2.44 | 6 | ||
| Liberal | 394,003 | 40.21 | –1.55 | 5 | ||
| Australian Greens | 117,364 | 11.98 | +5.03 | |||
| Family First Party | 48,638 | 4.96 | +0.91 | |||
| Australian Democrats | 7,020 | 0.72 | −0.79 | |||
| Independents | 5,086 | 0.52 | –0.18 | |||
| The Climate Sceptics | 3,525 | 0.36 | +0.36 | |||
| Liberal Democratic Party | 2,833 | 0.29 | +0.12 | |||
| One Nation | 1,105 | 0.11 | −0.06 | |||
| Socialist Alliance | 786 | 0.08 | +0.08 | |||
| Secular Party of Australia | 310 | 0.03 | +0.03 | |||
| Total | 979,949 | 11 | ||||
| Two-party-preferred vote | ||||||
| Australian Labor Party | 521,115 | 53.18 | +0.78 | 6 | ||
| Liberal | 458,834 | 46.82 | –0.78 | 5 | ||
| Invalid/blank votes | 56,565 | 5.46 | +1.68 | |||
| Registered voters/turnout | 1,104,698 | 93.83 | ||||
| Source: Commonwealth Election 2010 | ||||||
Tasmania
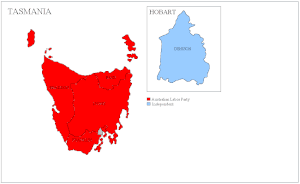
Electoral divisions: Tasmania
| Party | Votes | % | Swing | Seats | Change | |
|---|---|---|---|---|---|---|
| Australian Labor Party | 143,796 | 43.95 | +1.18 | 4 | ||
| Liberal | 109,908 | 33.60 | –4.62 | 0 | ||
| Australian Greens | 55,042 | 16.82 | +3.32 | |||
| Independents | 15,627 | 4.78 | +2.56 | 1 [lower-alpha 2] | ||
| Secular Party of Australia | 1,085 | 0.33 | +0.33 | |||
| Socialist Alliance | 856 | 0.26 | +0.00 | |||
| Citizens Electoral Council | 838 | 0.26 | −0.31 | |||
| Total | 327,152 | 5 | ||||
| Two-party-preferred vote | ||||||
| Australian Labor Party | 198,332 | 60.62 | +4.41 | 4 | ||
| Liberal | 128,830 | 39.38 | –4.41 | 0 | ||
| Invalid/blank votes | 13,791 | 4.04 | +1.12 | |||
| Registered voters/turnout | 358,609 | 95.07 | ||||
| Source: Commonwealth Election 2010 | ||||||
Territories

Electoral divisions: Territories
Australian Capital Territory
| Party | Votes | % | Swing | Seats | Change | |
|---|---|---|---|---|---|---|
| Australian Labor Party | 100,700 | 45.02 | –6.08 | 2 | ||
| Liberal | 77,880 | 34.81 | +1.58 | 0 | ||
| Australian Greens | 42,942 | 19.20 | +6.04 | |||
| Secular Party of Australia | 2,175 | 0.97 | +0.97 | |||
| Total | 223,697 | 2 | ||||
| Two-party-preferred vote | ||||||
| Australian Labor Party | 137,948 | 61.67 | –1.73 | 2 | ||
| Liberal | 85,749 | 38.33 | +1.73 | 0 | ||
| Invalid/blank votes | 10,926 | 4.66 | +2.35 | |||
| Registered voters/turnout | 247,941 | 94.63 | ||||
| Source: Commonwealth Election 2010 | ||||||
Northern Territory
| Party | Votes | % | Swing | Seats | Change | |
|---|---|---|---|---|---|---|
| Country Liberal Party | 38,335 | 40.83 | –0.20 | 1 | ||
| Australian Labor Party | 35,589 | 37.91 | –9.74 | 1 | ||
| Australian Greens | 12,175 | 12.97 | +4.92 | |||
| Independents | 3,948 | 4.21 | +1.55 | |||
| Citizens Electoral Council | 2,331 | 2.48 | +2.23 | |||
| One Nation | 1,505 | 1.60 | +1.60 | |||
| Total | 93,883 | 2 | ||||
| Two-party-preferred vote | ||||||
| Australian Labor Party | 47,636 | 50.74 | –4.67 | 1 | ||
| Country Liberal Party | 46,247 | 49.26 | +4.67 | 1 | ||
| Invalid/blank votes | 6,198 | 6.19 | +2.34 | |||
| Registered voters/turnout | 121,059 | 82.67 | ||||
| Source: Commonwealth Election 2010 | ||||||
See also
Notes
- ↑ The Liberal National Party was an amalgamation of the Liberal Party and National Party in Queensland. Change is compared to the coalition total in 2007.
- 1 2 3 4 The independents were Bob Katter (Kennedy, Qld), Rob Oakeshott (Lyne, NSW), Andrew Wilkie (Denison, Tas) and Tony Windsor (New England, NSW).
- 1 2 The National Party of Western Australia prior to and subsequent to the election were not in the federal Coalition agreement. Nationals WA MP Tony Crook stated that he was a crossbencher, and has said: "In every news report and press report we see, my number is being allocated in with the Coalition and it shouldn't be".[6] Thus, the party has been counted separately from the Coalition totals.
- ↑ The abolished district was Lowe (Labor).
- ↑ The new seat was Wright.
References
- ↑ State by state breakdowns: AEC
- ↑ State by state primary vote: AEC Archived 2010-08-23 at the Wayback Machine
- ↑ State by state 2PP: AEC Archived 2010-09-23 at the Wayback Machine
- ↑ Barber, Stephen (15 August 2011). "Commonwealth Election 2010" (PDF). Research Paper 2 2011–12. Parliamentary Library. ISSN 1834-9854.
- ↑ 2010 nationwide 2PP preference flows and 2007 flows: AEC
- ↑ Ker, Peter (26 August 2010). "Don't count me among Coalition, says Nat". The Age. Fairfax Media. Retrieved 27 August 2010.
External links
- Two-party swing by seat: Psephos
- Historical two-party state-by-state results (1949 to present): Australian Electoral Commission
- Psephos (Dr Adam Carr) archive page for the electoral geography of the 2010 Australian election
| House of Representatives | |||
|---|---|---|---|
| Senate | |||
| By-elections | |||
This article is issued from Wikipedia. The text is licensed under Creative Commons - Attribution - Sharealike. Additional terms may apply for the media files.